This winter, the Florida legislature is expected to pass new state legislative and congressional district maps. The purpose of this process is to account for population changes that have occurred over the past decade as measured by recently released 2020 Census data. The population changes in Florida have been substantial: the state grew from 18,801,310 to 21,538,187 people between 2010 and 2020. While the nation saw a 7.4 percent increase in its population during that period, Florida’s rate of growth was nearly double that, at 14.6 percent. As a result, it is one of the few states to gain congressional representation for the coming decade.
As in the 2011 redistricting cycle, Republican lawmakers will have total control over the redistricting process. But unlike many states, Florida has safeguards written into state law that go beyond the protections of the U.S. Constitution and the federal Voting Rights Act. The state constitution, for example, prohibits maps that discriminate against racial and ethnic minorities and bans intentional partisan gerrymandering. During the past decade, the Florida Supreme Court enforced these protections and redrew several congressional and state legislative districts. However, the membership of the court has changed significantly since then, creating uncertainty as to whether challenges to unfair maps will be successful this time around.
Thus, Florida’s 120 state house, 40 state senate, and 28 congressional districts are bring drawn under single-party control and assessed by a state supreme court bench with no history of enforcing the state’s protections. This analysis summarizes Florida’s major population trends of the last decade, both statewide and in its fastest-growing metro areas, and examines their redistricting implications.
Highlights:
- Nonwhite Floridians accounted for over 90 percent of the 2,736,877 people the state added to its population in the last decade, thanks largely to an increase in the Latino population.
- Central Florida’s I-4 corridor, especially the areas surrounding Orlando and Tampa, saw the greatest growth, meaning that it could be the landing spot for Florida’s new congressional district. Other urban areas, including Miami, Tampa, and Jacksonville, also saw considerable increases in their populations.
Statewide Analysis
Between 2010 and 2020, Florida gained almost 3 million residents, more than any other state besides Texas.1 While Florida enjoyed significant growth statewide, the Miami, Orlando, and Tampa metro areas saw the greatest increases. According to 2019 estimates, domestic in-migration and international immigration accounted for almost 90 percent of this population increase, with more people moving to Florida than any other state in the country.2 Notably, Florida has seen a 44 percent increase in its Puerto Rican population over the past decade, in no small part due to migration after Hurricane Maria devastated the island in 2017.3
The state’s growth was not distributed evenly across demographic groups. Though Florida saw a substantial increase in its population, these gains were driven by nonwhite residents. While Florida’s white population grew by 215,781 people, nonwhite communities added 2,521,096 people to their totals, representing roughly 90 percent of overall population growth. Thus, Florida’s white population, while still a majority, saw its share of the total population decline from 58 to 52 percent.
Multiracial Floridians grew by a greater percentage than any single racial or ethnic group, increasing by 501,129 people, or 172 percent, since 2010.4 Latino Floridians increased their total by 1,473,434 people, the largest absolute gain of any demographic group. The Asian population saw the largest percentage increase of any single racial or ethnic group in the last decade, growing by 184,410 people, or 41 percent. The changes in Florida’s citizen voting age population, which is often used as a stand-in for measuring the population of eligible voters, largely mirror statewide population trends.5
Geographically, Florida’s population growth was centered in and around its major cities. Overall, the state’s population gains were evenly split among its largest metro areas. Orange County, home to Orlando, saw the biggest gains, adding 283,952 people and accounting for more than 10 percent of the state’s population growth. Likewise, Miami-Dade County and Tampa’s Hillsborough County each contributed more than 7 percent of overall gains. Jacksonville’s Duval County saw more modest numbers, adding 131,304 people and accounting for about 5 percent of the state’s increases. While most of Florida’s counties saw their population rise, at least modestly, 17 counties, largely concentrated in northern Florida, experienced population decline.
Given these changes, central Florida should see additional representation because of its strong growth relative to other regions of the state. The seven counties in central Florida’s I-4 corridor, which include the Tampa and Orlando metro areas, now have the population to support nearly three additional state house districts, an additional state senate district, and an additional congressional district.6 How these districts are drawn will determine which communities will wield greater political power in Tallahassee and Washington for the next decade
Regional Analysis
An analysis of Florida’s three largest metro areas illustrates the wider demographic changes that have occurred across the state over the past decade. Orange County and Hillsborough County had the largest population increases in the state, growing by 283,952 people and 230,536 people, respectively. Osceola County, adjacent to Orange County, saw the greatest percentage increase in population of any county since 2010, growing by 45 percent. Similar to statewide trends, the growth in central Florida’s largest metro areas was driven by the increase in the nonwhite population, which accounted for almost 100 percent of the gains in Hillsborough, Orange, and Osceola Counties. The maps below show how nonwhite populations increased in the counties’ more suburban areas.
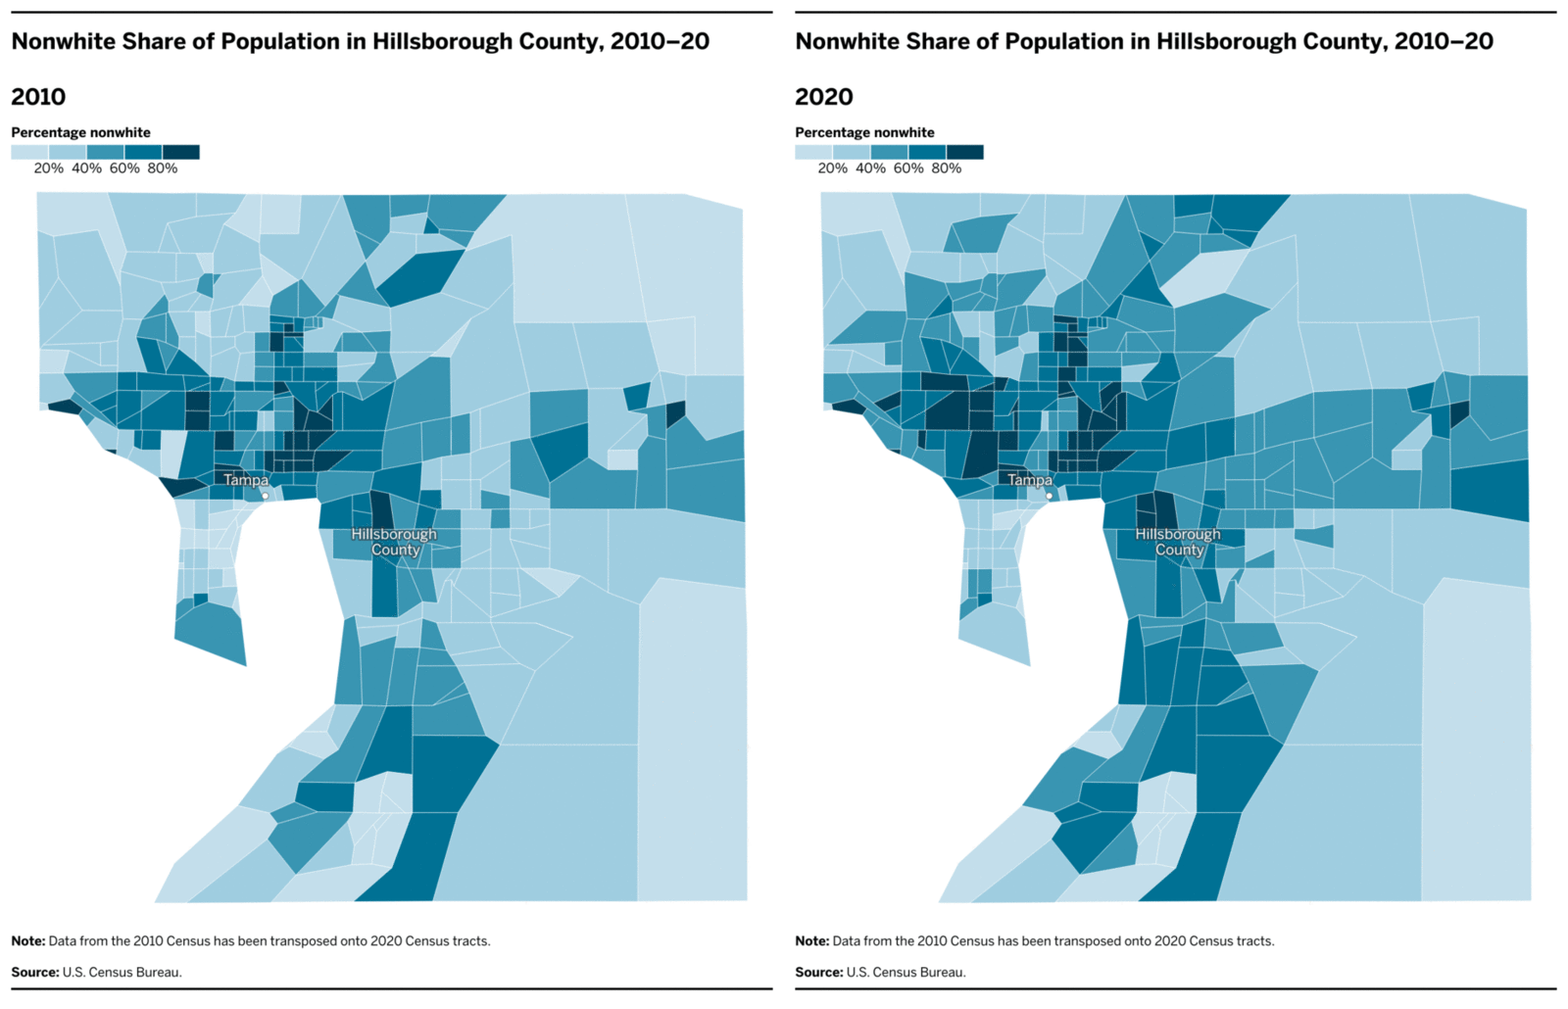

In Hillsborough and Orange Counties, over 50 percent of the past decade’s population growth can be attributed to Latinos, and in Osceola County the figure is almost 75 percent. Despite the massive growth of the Latino population, legislators may still draw districts that dilute their political power. For example, majority-nonwhite areas in the region could be consolidated into relatively few districts, giving more power to older, whiter areas such as the Villages, a retirement community in nearby Sumter County that has become whiter over the past decade and was also the fastest-growing municipality in the country.7
Much of the increase in Latino communities in central Florida can be attributed to the growth of the Puerto Rican population, especially in metro Orlando. In Orange and Osceola Counties, people of Puerto Rican descent make up the largest share of the Latino population.8 As of 2019, nearly 1 in 10 people living in Orange and Osceola Counties were born in Puerto Rico.9
These increases are already affecting the political landscape, not just in central Florida but in the country at large. In 2016, Democrat Darren Soto of Orlando became the first Puerto Rican to represent Florida in Congress. Soto has become a strong advocate for Puerto Rican statehood, putting pressure on Democrats and Republicans alike.10 Advocacy organizations in Florida are also capitalizing on the growth of the Puerto Rican population to reenergize a campaign for statehood.11 As people of Puerto Rican descent exercise their growing political power in central Florida, statehood is likely to receive more attention, especially if a new central Florida congressional district strengthens the Puerto Rican population’s political influence in Washington.
The nonwhite population also increased in Miami-Dade County over the past decade. The share of the nonwhite population there grew from 85 percent to 87 percent. Though the increase may seem negligible, it underscore the evolution of suburban communities.
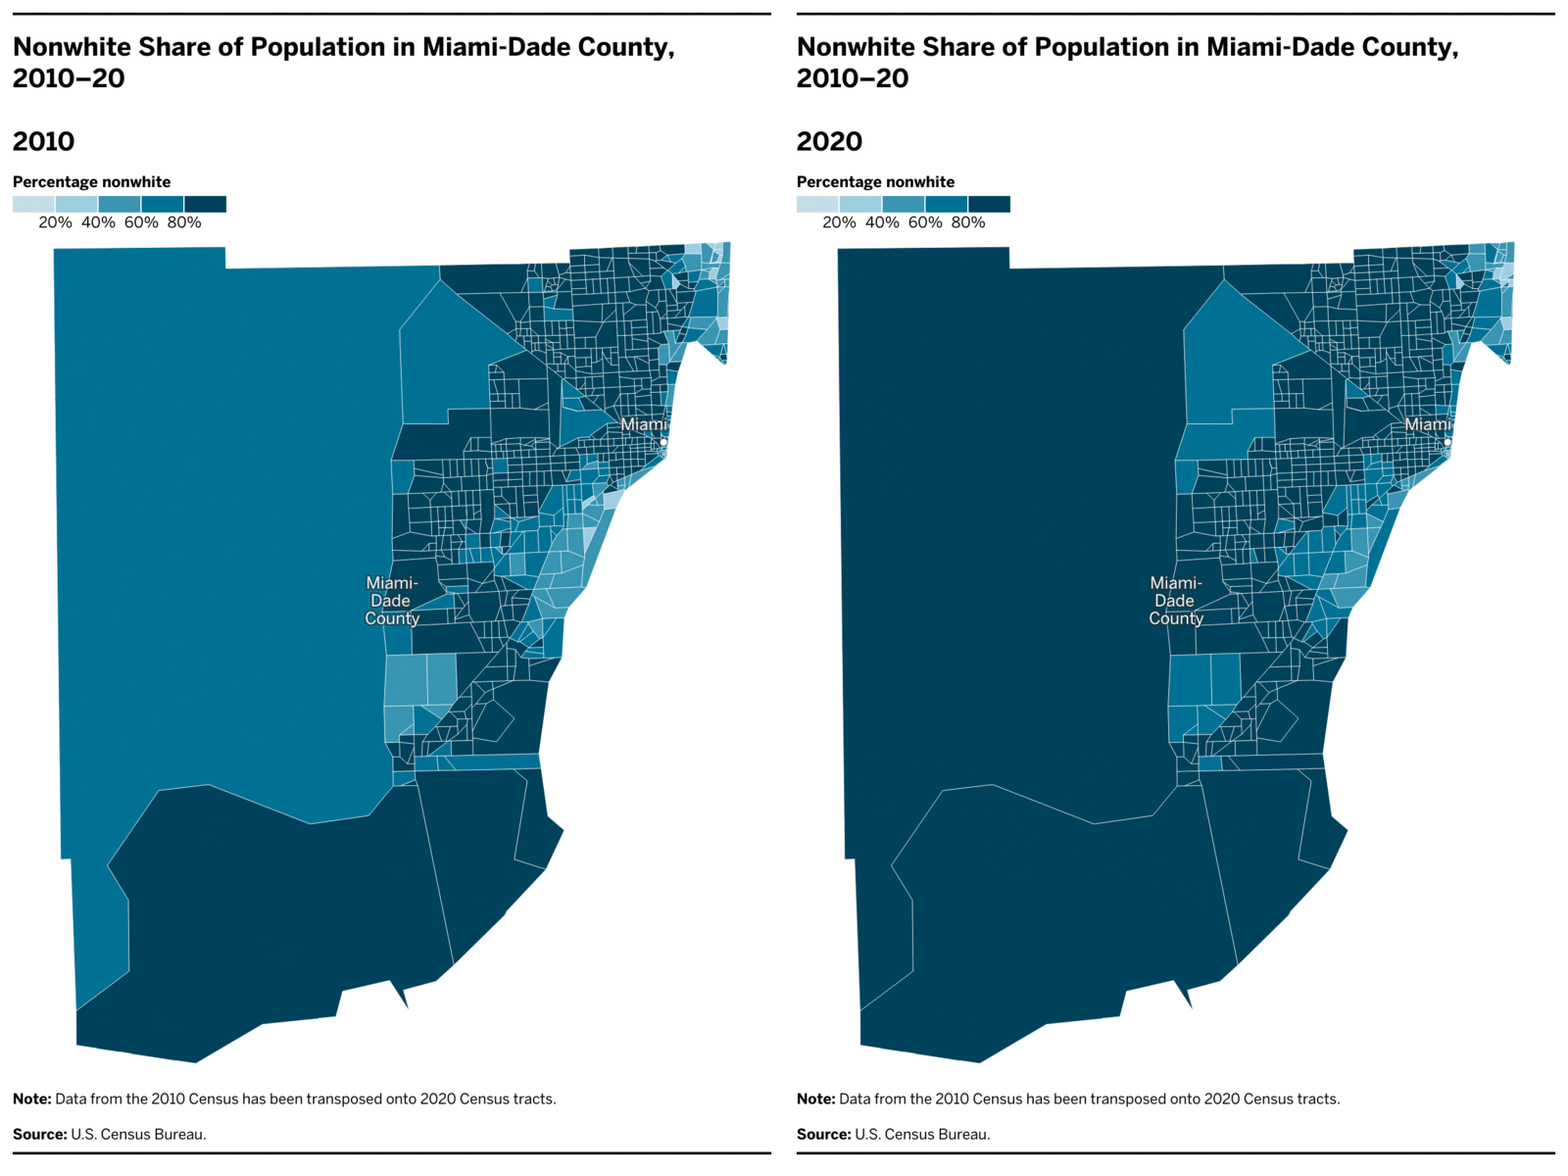
Between 2010 and 2020, Miami-Dade’s white population decreased by over 20,000 people, shrinking from 15 percent of the population to 13 percent. There was an even greater decrease in the county’s Black population, which shrank by 46,894 people, from 17 percent of the population to 11 percent. The Latino population not only compensated for these losses but accounted for all of Miami-Dade’s growth over the last decade.
The majority of Miami-Dade’s Latino population is of Cuban descent. In 2019, 53 percent of Latinos in Miami-Dade County and 36 percent of all county residents identified as Cuban. This is by far the largest subgroup among Latinos in Miami-Dade County — the next largest subgroup, those of Nicaraguan descent, made up only 6 percent of the county’s Latino population and 4 percent of its overall population.12
The size and consistently high voter turnout of Miami-Dade’s Cuban population underscores its importance in elections. Unlike many other Latino subgroups, Latinos of Cuban descent lean Republican, though this has lessened somewhat in recent years.13 In the 2016 presidential election, Donald Trump lost Miami-Dade County by almost 300,000 votes, and in 2018 Democrats flipped two Miami-Dade House seats. But by 2020, Trump made some electoral gains with Cuban voters across the county, contributing to his win in Florida.14
The shifting political landscape in southern Florida adds complexity to a state that has long been a critical battleground. In redistricting, the differences among Latino subgroups’ political leanings may impact how maps are drawn. Republican legislators may want to increase the power of Miami-Dade’s Cuban population and dilute the power of central Florida’s Puerto Rican population despite its significant growth. These decisions could be the subject of future litigation and will have significant ramifications in Tallahassee and Washington.
Conclusion
Florida’s demographic changes over the past decade show that the state is quickly growing and diversifying. Whether the redistricting process accounts for this change, especially as the state gains a congressional district, will be crucial to understanding the electoral landscape in Florida.
Endnotes
-
1
U.S. Census Bureau, “Table A. Apportionment Population, Resident Population, and Overseas Population: 2020 Census and 2010 Census,” April 26, 2021, available at https://www.census.gov/programs-surveys/decennial/2020/data/apportionment/apportionment-2020-table01.pdf. -
2
All told, between 2010 and 2019 Florida gained 1,289,614 residents through domestic migration and 1,107,039 residents through international migration. Although Puerto Rico is a territory of the United States, the Census Bureau classifies migration from Puerto Rico as international migration. U.S. Census Bureau, “Table 4. Cumulative Estimates of the Components of Resident Population Change for the United States, Regions, State, and Puerto Rico and Region and State Rankings: April 1, 2010 to July 1, 2010,” December 2019, https://www.census.gov/data/tables/time-series/demo/popest/2010s-state-total.html. -
3
Between 2010 and 2019 the number of Floridians who reported being born in Puerto Rico rose from 374,172 to 539,177. It is estimated that of the more than 130,000 Puerto Ricans who moved to the mainland United States between 2017 and 2018, one-third moved to Florida. U.S. Census Bureau, “State of Residence by Place of Birth,” from the American Community Survey, April 2020, https://www.census.gov/data/tables/time-series/demo/geographic-mobility/state-of-residence-place-of-birth-acs.html; and Brian Glassman, “A Third of Movers From Puerto Rico to the Mainland United States Relocated to Florida in 2018,” U.S. Census Bureau, September 26, 2019, https://www.census.gov/library/stories/2019/09/puerto-rico-outmigration-increases-poverty-declines.html. -
4
Because the Census Bureau categorized write-in responses to the race and ethnicity questions differently in 2020 and 2010, the number of people reported in the 2020 data as identifying with multiple racial groups was expected to be higher. In other words, part of this increase likely reflects actual growth, but part of it can be attributed to methodological changes. Hansi Lo Wang, “What the New Census Data Can — and Can’t — Tell Us About People Living in the U.S.,” NPR, August 12, 2021, https://www.npr.org/2021/08/12/1010222899/2020-census-race-ethnicity-data-categories-hispanic; and Rachel Marks and Merarys Rios-Vargas, “Improvements to the 2020 Census Race and Hispanic Origin Question Designs, Data Processing, and Coding Procedures,” U.S. Census Bureau, August 3, 2021, https://www.census.gov/newsroom/blogs/random-samplings/2021/08/improvements-to-2020-census-race-hispanic-origin-question-designs.html. -
5
Detailed comparisons of citizen voting age population changes over the past decade are omitted here due to a lack of equivalent data sources, as work on the special tabulations of the voting-eligible population for 2020 has been suspended indefinitely. U.S. Census Bureau, “Post-2020 Census CVAP Special Tabulation,” October 30, 2020, https://www.census.gov/programs-surveys/decennial-census/about/voting-rights/cvap/Post-2020-CVAP.html. -
6
The I-4 corridor, named after Interstate 4, stretches from the Gulf Coast to Daytona Beach. It includes Pinellas, Hillsborough, Polk, Osceola, Orange, Seminole, and Volusia Counties. Ideal district population sizes are calculated by dividing the total population of Florida (18,801,310 in 2010 and 21,538,187 in 2020) by the number of Florida districts in the relevant category (40 for state senate, 120 for state house, and 27 for Congress after 2010 and 28 after 2020). The ideal size for a state house district was 156,678 in 2010 and 179,485 in 2020; for a state senate district, 470,033 in 2010 and 538,455 in 2020; and for a congressional district, 696,345 in 2010 and 769,221 in 2020. In 2010, I-4 counties would have been entitled to 30.69 state house districts, 10.23 state senate districts, and 6.91 congressional districts. As of 2020, these counties are entitled to 33.36 state house districts, 11.1 state senate districts, and 7.78 congressional districts. -
7
Audra Burch, “The Villages, a Retirement Community in Florida, Was the Fastest-Growing Metro Area over the Last Decade,” New York Times, August 12, 2021, https://www.nytimes.com/2021/08/12/us/the-villages-census-florida-population.html. -
8
According to the American Community Survey, the Latino population in these counties grew by 217,365. Of this, 109,359 people, or 50.3 percent, were of Puerto Rican descent. The next largest subgroup, Latinos of Mexican descent, only accounted for 4 percent of this growth. U.S. Census Bureau, “Hispanic or Latino by Specific Origin,” from the 2010 American Community Survey 5-Year Estimates, December 8, 2011, https://data.census.gov/cedsci/table?q=hispanic%20origin&g=0500000US12095,12097&tid=ACSDT5Y2010.B03001&hidePreview=true; and U.S. Census Bureau, “Hispanic or Latino by Specific Origin,” from the 2019 American Community Survey 5-Year Estimates, December 10, 2020, https://data.census.gov/cedsci/table?q=hispanic%20origin&g=0500000US12095,12097&tid=ACSDT5Y2019.B03001&hidePreview=true. -
9
In 2010, 105,937 residents of Orange and Osceola Counties reported being born in Puerto Rico. In 2019, that number rose to 165,664 — a 56 percent increase. U.S. Census Bureau, “State of Residence by Place of Birth.” -
10
Brian Latimer, “Darren Soto Elected First Puerto Rican Congressman from Florida,” NBC News, November 8, 2016, https://www.nbcnews.com/news/latino/darren-soto-elected-first-puerto-rican-congressman-florida-n680741; and Steven Lemongello and Jennifer A. Marcial Ocasio, “Puerto Rico’s Road to Statehood Could Run Through Florida,” Orlando Sentinel, November 20, 2020, https://www.orlandosentinel.com/politics/os-ne-puerto-rico-statehood-20201120-bcoahvrtujgsdgbicysqw5kwku-story.html . -
11
Jesse Canales, “New National Nonprofit for Puerto Rico Statehood Starts Push from Florida,” Spectrum News 13, June 6, 2021, https://www.mynews13.com/fl/orlando/news/2021/06/04/new-nonprofits-aims-for-statehood-for-puerto-rico. -
12
U.S. Census Bureau, “Hispanic or Latino by Specific Origin” from the 2019 American Community Survey 5-Year Estimates. -
13
In 2020, 58 percent of Cuban American voters nationally affiliated with the Republican Party, compared with 32 percent of non-Cuban Hispanics. People of Cuban descent also turn out to vote at the highest rates of all Latino origin subgroups; in 2016, 58 percent of Americans of Cuban descent voted, compared with 48 percent of all Latino voters. Jens Manuel Krogstad, “Most Cuban American Voters Identify as Republican in 2020,” Pew Research Center, October 2, 2020, https://www.pewresearch.org/fact-tank/2020/10/02/most-cuban-american-voters-identify-as-republican-in-2020/; and Jens Manuel Krogstad and Antonio Flores, “Unlike Other Latinos, About Half of Cuban Voters in Florida Backed Trump,” Pew Research Center, November 15, 2016, https://www.pewresearch.org/fact-tank/2016/11/15/unlike-other-latinos-about-half-of-cuban-voters-in-florida-backed-trump . -
14
Carmen Sesin, “Trump Cultivated the Latino Vote in Florida, and It Paid Off,” NBC News, November 4, 2020, https://www.nbcnews.com/news/latino/trump-cultivated-latino-vote-florida-it-paid-n1246226 .


