Skip Navigation
Resource

Patterns in the Introduction and Passage of Restrictive Voting Bills are Best Explained by Race

White racial resentment — and not just party and competitiveness alone — goes a long way toward explaining where restrictive voting laws were introduced and passed in 2021.

Published: August 3, 2022

This study has been published in the peer-reviewed Journal of Race, Ethnicity, and Politics. The un-paywalled academic version can be found here.

Over the past 18 months, there has been an unprecedented wave of anti-voter legislation introduced and passed across the country. In 2021, at least one bill with a provision restricting access to voting was introduced in the legislature of every state except Vermont. By early May of this year, nearly 400 restrictive bills had been introduced in legislatures nationwide.

Legislators and researchers have given different explanations for this wave. The mostly Republican lawmakers supporting these bills often argue that the new provisions are necessary to protect election integrity, despite the absence of widespread fraud in American elections. Commentators argue that Republican legislators are pushing to change election laws to guarantee political advantages for their party. Some past research supports this argument, demonstrating that certain restrictive voting policies are most likely to be adopted in electorally competitive states controlled by Republicans. Other scholarship shows that states pass restrictive voting laws when Americans of color have strong and growing political power.

The Brennan Center has developed a unique data set for testing these explanations. Specifically, we tracked every restrictive voting provision introduced in every state legislature in 2021 (as we do every year) and used Legiscan data to identify the sponsors of these bills. We then examine which district-level characteristics are most correlated with whether a lawmaker sponsored a restrictive voting bill.

We tested several factors, including the partisan and racial makeup of legislative districts and states as well as the racial opinions of constituents. Our research shows that racial factors were powerful predictors of sponsorship. This is consistent with the theory that “racial backlash” — a theory describing how white Americans respond to a perceived erosion of power and status by undermining the political opportunities of minorities — is driving this surge of restrictive legislation. To be sure, the data also confirm that partisanship is a powerful predictor of sponsorship. But even after accounting for racially polarized voting in the United States, we show that racial demographics are a powerful factor independent of party in determining where restrictive voting laws are introduced and passed.

To evaluate the impact that race has on sponsorship, we use two measurements. First, we look simply to the racial makeup of the districts represented by the bill sponsors and their home states. Second, we use responses to a survey called the 2020 Cooperative Election Study (CES). We leverage responses to two questions that have been used for years to measure what political scientists call “racial resentment.”footnote1_g8vR-hJLPgMEL-DQW-FXygc1J8c9i6Zh76eWhbwnibc_bCaXY2SkqlVO1Respondents are asked how much they agree with the following statements on a scale of 1 to 5: “Irish, Italians, Jewish and many other minorities overcame prejudice and worked their way up. Blacks should do the same without any special favors” and “Generations of slavery and discrimination have created conditions that make it difficult for blacks to work their way out of the lower class.” We reverse code agreement with the second statement.It’s important to note that this measure does not and cannot identify whether, as the Brennan Center’s Ted Johnson explains, there’s “a racist bone in your body.”

Instead, it measures how white Americans think about the role of race in politics, and it is generally a good proxy — in the aggregate — for how racially conservative Americans are. These scores cannot be used to neatly rank each and every legislative district according to how “racist” it is. Rather, we argue that districts with higher racial resentment scores on the survey are generally more likely to feel threatened by America’s growing racial diversity. The fact that higher scores are associated with higher rates of sponsorship even after accounting for partisanship underscores the explanatory power of these questions.footnote2_FlAWkprKsvkpoA5b9cvSx4ya1oOhUdnrisgS7iK0gk0_cGdFiId1W7iC2Some researchers disagree about what precisely these questions capture, given how correlated they can be with other conservative beliefs like individualism, limited government, and self-reliance (see, for instance, this paper). Nevertheless, most political scientists agree that the racial resentment score captures important information about Americans’ racial views, and it remains central to scholarship on race and politics in the United States.
Our key findings at the legislative district level include:

  • Representatives from the whitest districts in the most racially diverse states were the most likely to sponsor anti-voter bills.
  • Districts with higher racial resentment were more likely to be represented by lawmakers who sponsored restrictive bills.

At the state level, we find:

  • It is the interaction between race and partisanship that matters. States with unified Republican control are not uniformly likely to introduce or pass restrictive provisions. In fact, predominantly white states are unlikely to introduce or pass restrictive provisions, regardless of which party controls the legislature. But racially diverse states controlled by Republicans are far more likely to introduce and pass restrictive provisions.

End Notes

Legislative District–Level Results: Racial Composition and Sponsorship

We start by exploring the relationship between race and restrictive voting legislation within states. We identified the legislative sponsor for each restrictive provision introduced in 2021 using data from Legiscan. We establish a few hypotheses based on what past research on racial backlash and legislative activity tells us. First, we think that whiter legislative districts are more likely to be represented by lawmakers who sponsor restrictive legislation. But that’s not all: we also expect the relationship between a district’s whiteness and the likelihood that its representative sponsored one of these restrictive bills will be stronger in more racially diverse states.

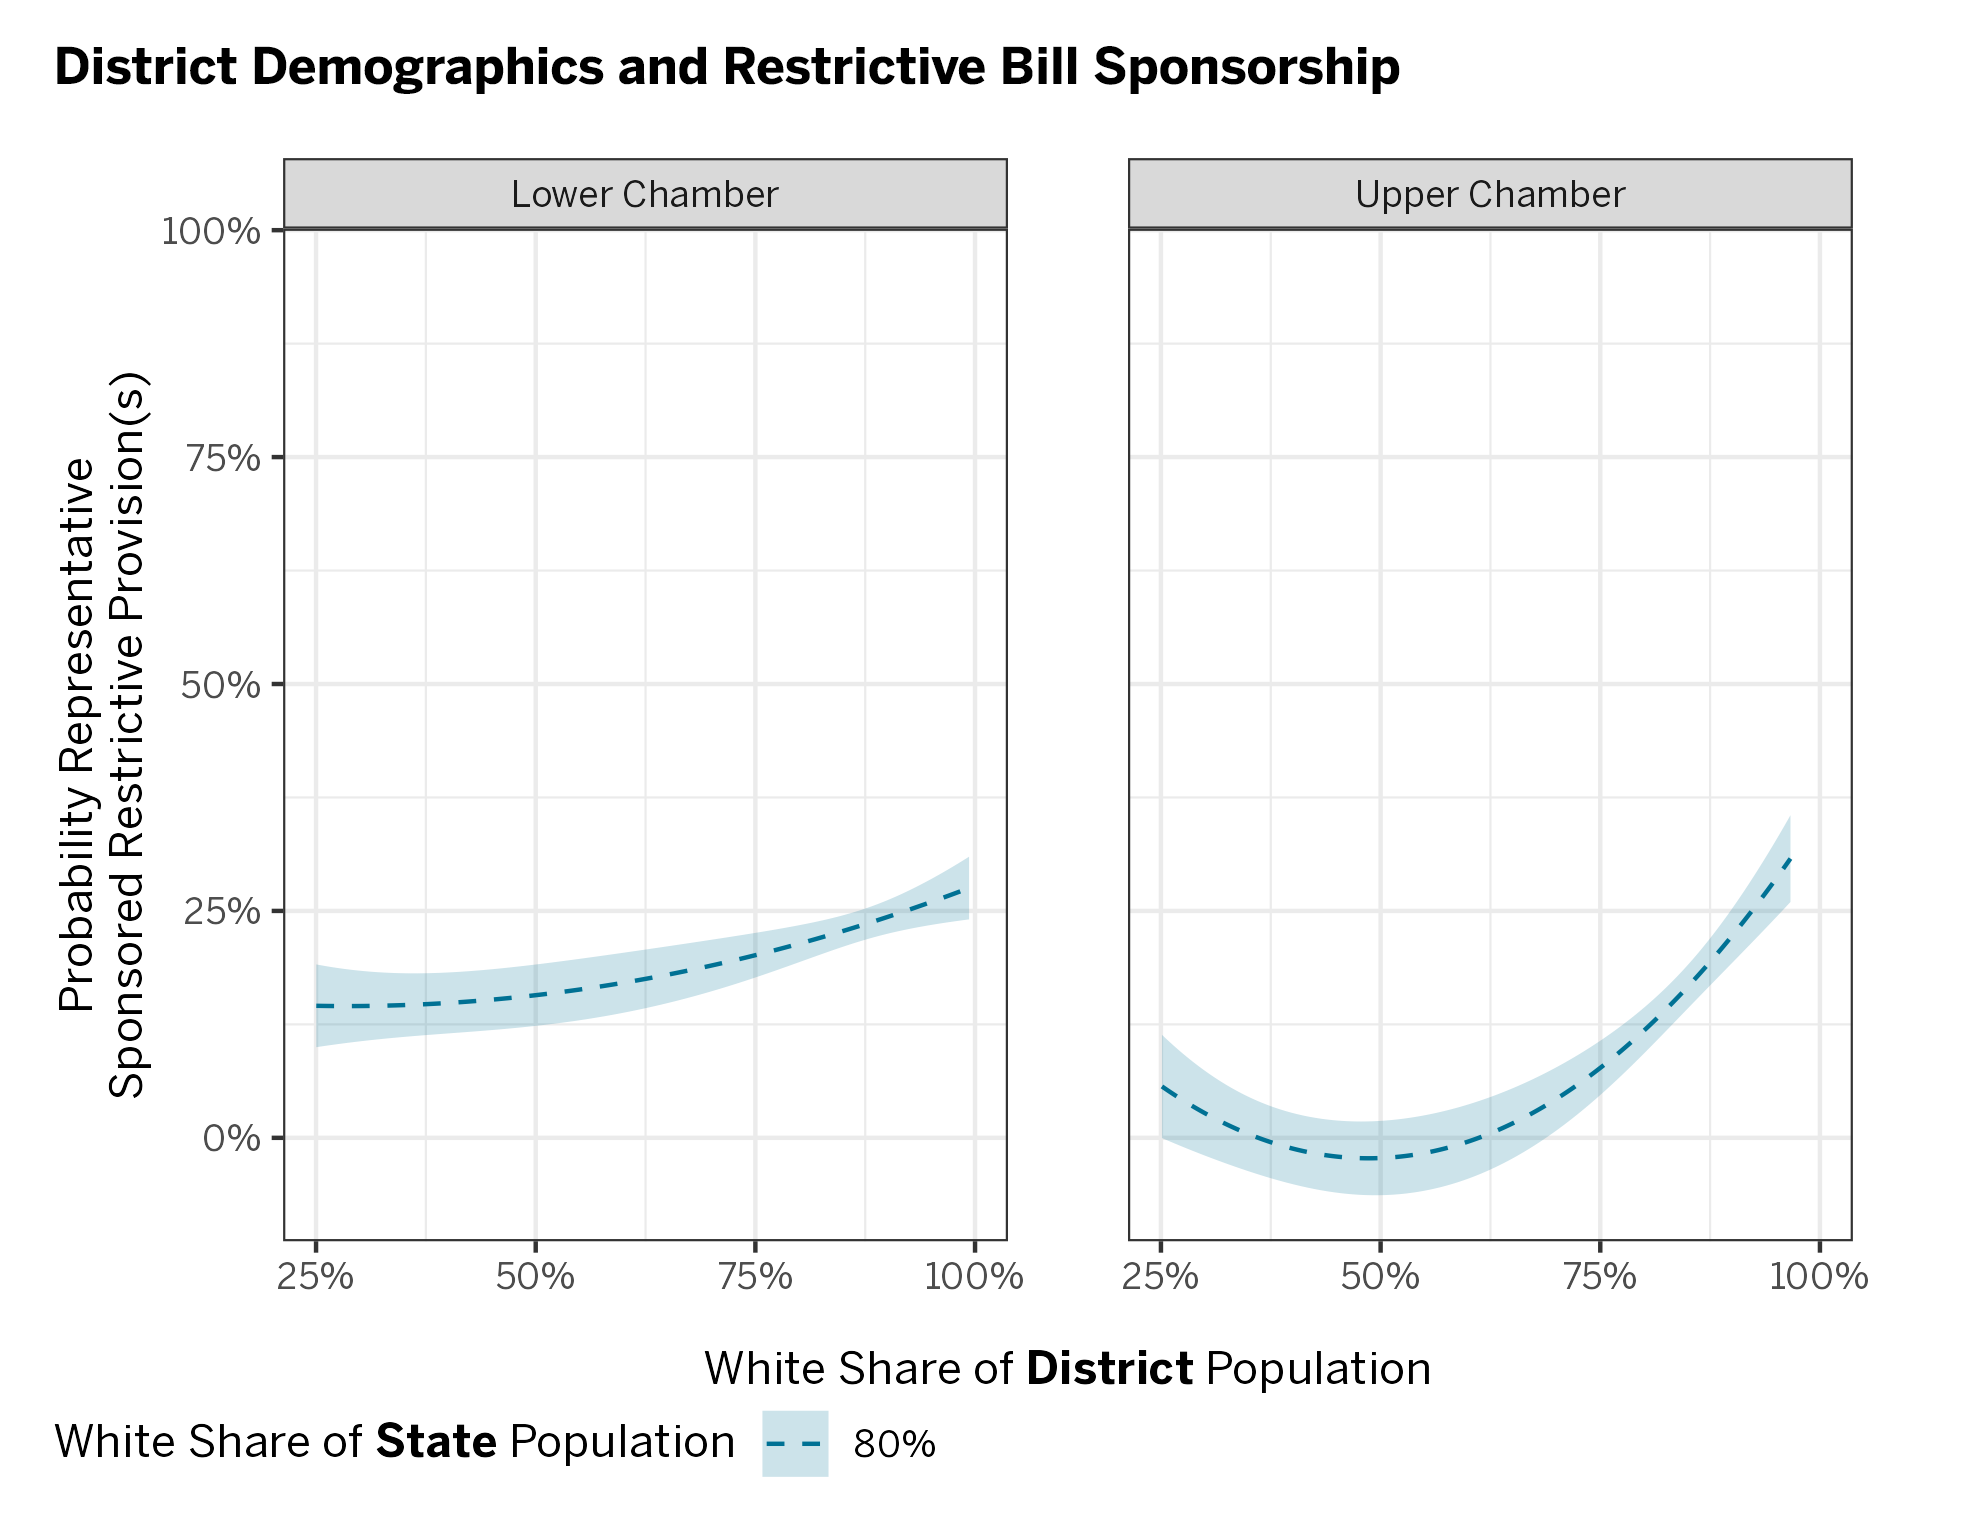
In the figure below, we graph the relationship between district whiteness and the likelihood that a lawmaker sponsored restrictive voting laws in whiter states. On the left-hand side, we plot the relationship in lower chambers; the right-hand side shows the relationship in upper chambers.footnote1_XWbApuc2b2ViAHbpYLMLt6u4Y-NdwKQyZXq8XXasGKA_vQ5iJecVOKk11Nebraska’s unicameral legislature is included in the upper chamber models.Here, we aren’t yet accounting for the fact that race and diversity are correlated with partisanship and competitiveness; these are just the simple relationships between race and legislative sponsorship. The bands around the lines represent confidence intervals, which measure uncertainty about the strength of the relationships. For more discussion of our methodology and results, please see the Technical Appendix at the bottom of this page.

We can see from this figure that there is a relatively weak relationship between whiteness and sponsorship in a state that’s about 80 percent white. On the left side of each plot — where we’re looking at less-white districts — the likelihood of being represented by a lawmaker who sponsored a restrictive bill is low. As we move to the right and look at whiter districts, that probability increases slightly. Thus, even in racially homogenous states, whiter districts are a little more likely to be represented by lawmakers who sponsor restrictive voting bills. 

Chart of district demographics and restrictive bill sponsorship

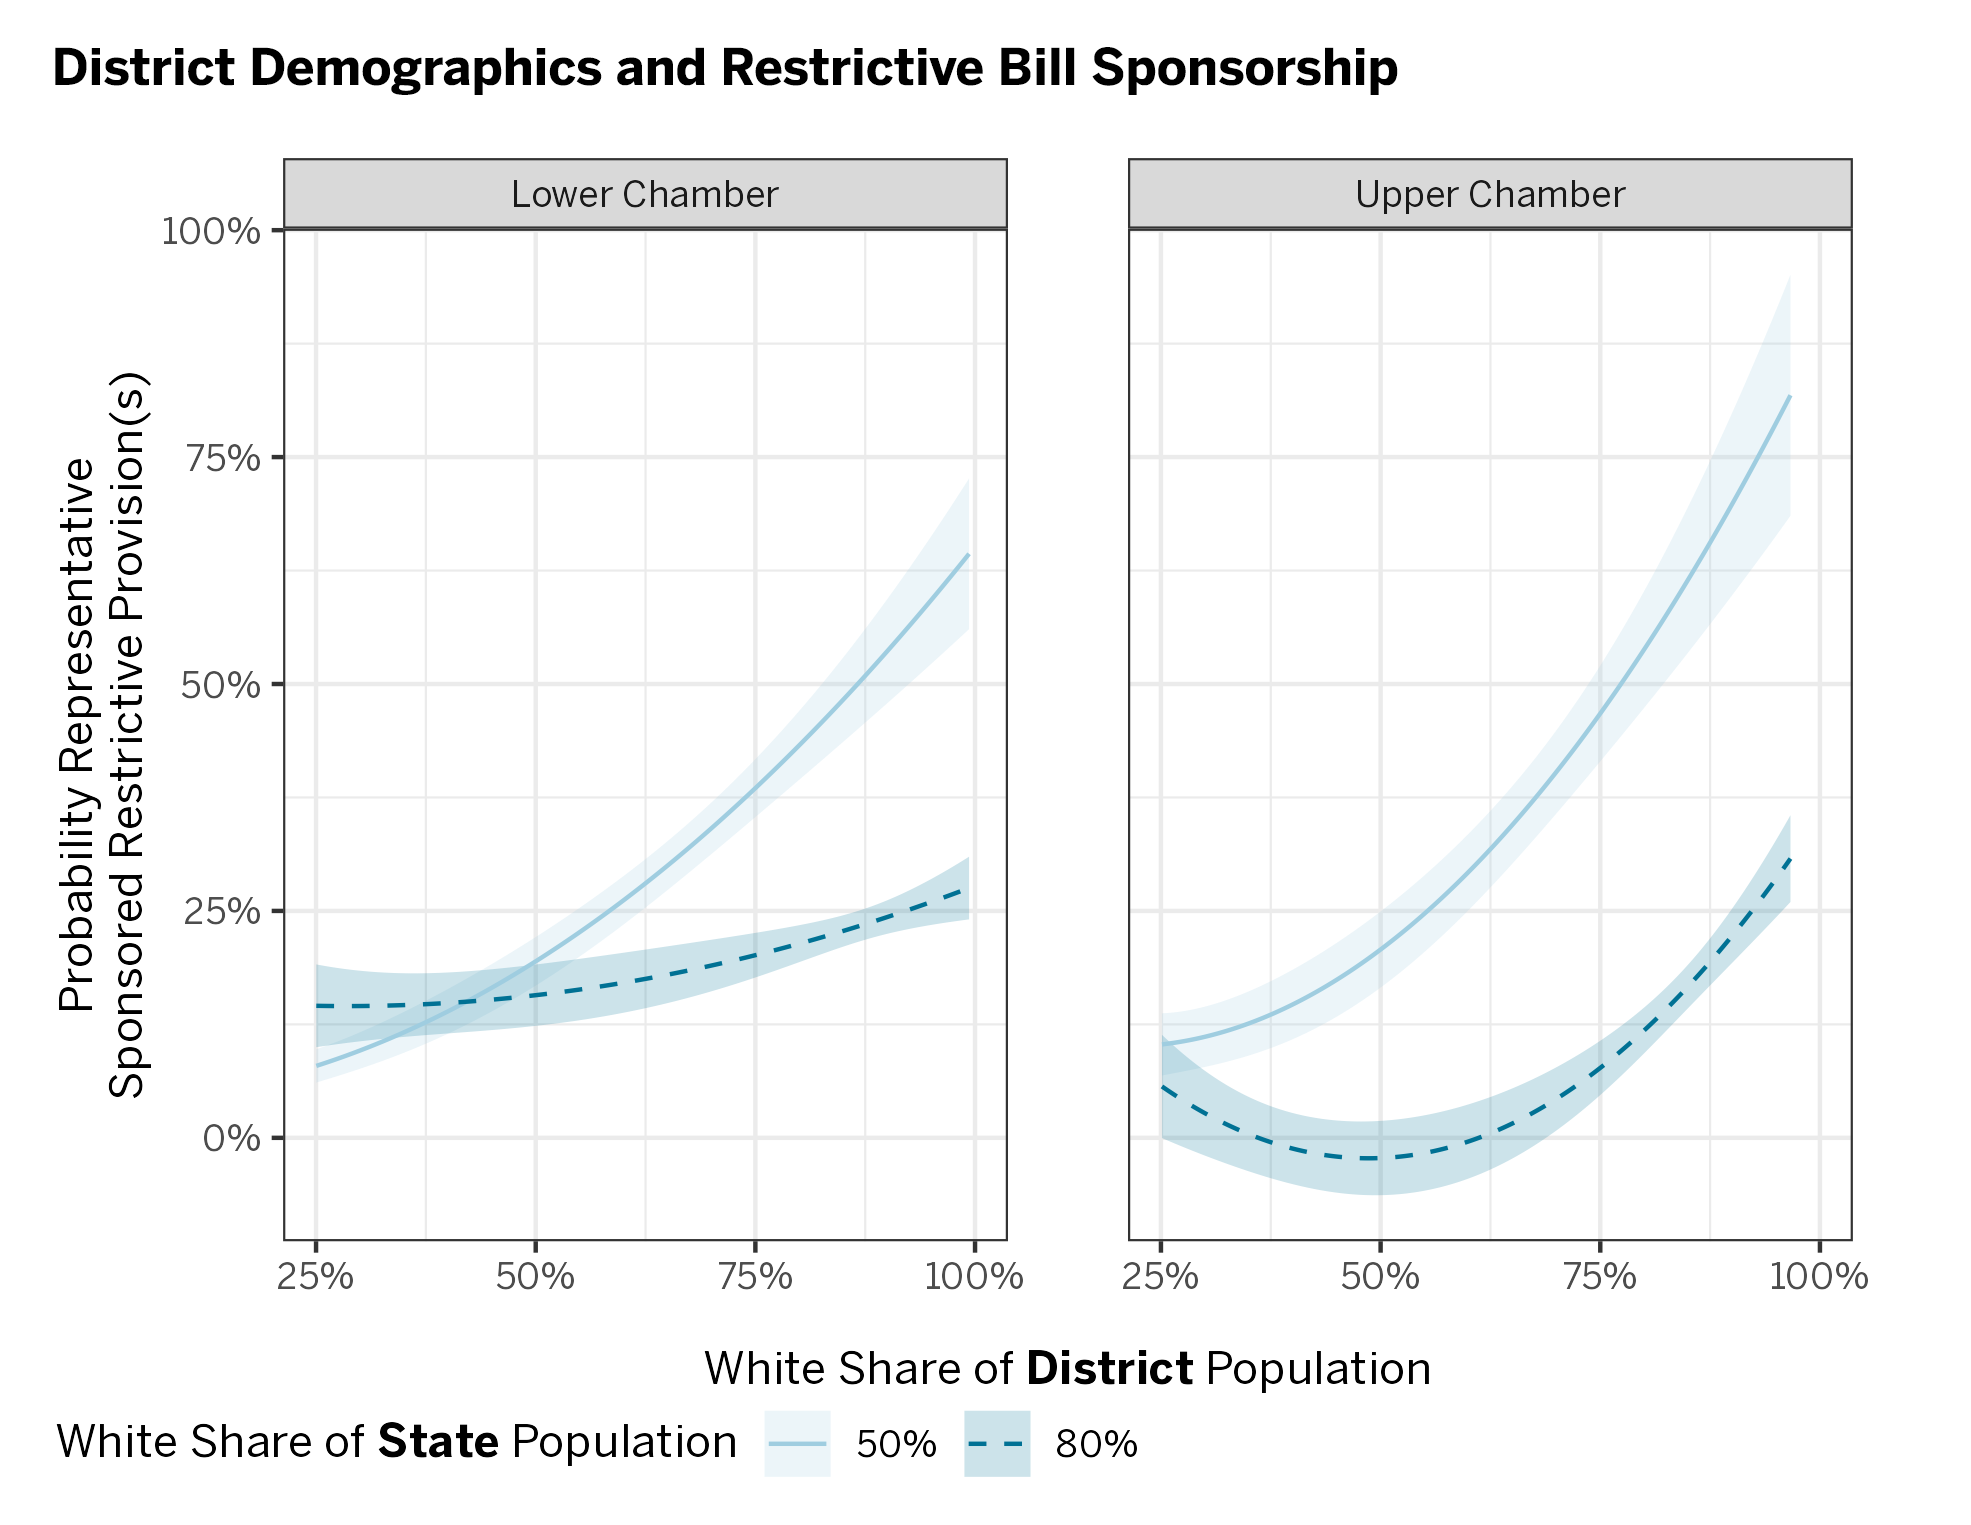
But we expected this relationship to be stronger in states with more racial diversity. In the next figure, we add in what the relationship between district demographics and sponsorship looks like in much more diverse states — defined here as states that are just 50 percent white. The relationship between race and sponsorship in the 80 percent white states stays the same as in the previous figure. The relationship in less-white states is plotted in lighter blue. In this figure, the light-blue line has a much steeper slope, indicating that there is a far larger difference between less-white and whiter districts in these states — just as we hypothesized.

Chart of district demographics and restrictive bill sponsorship

Of course, race, partisanship, and electoral competitiveness all move together in American politics. How do we know that these relationships aren’t just reflective of the fact that whiter districts are more Republican and that Republicans sponsor these bills at higher rates? Or that racially diverse states are more likely to be competitive and that these bills might be introduced at higher rates in competitive states?

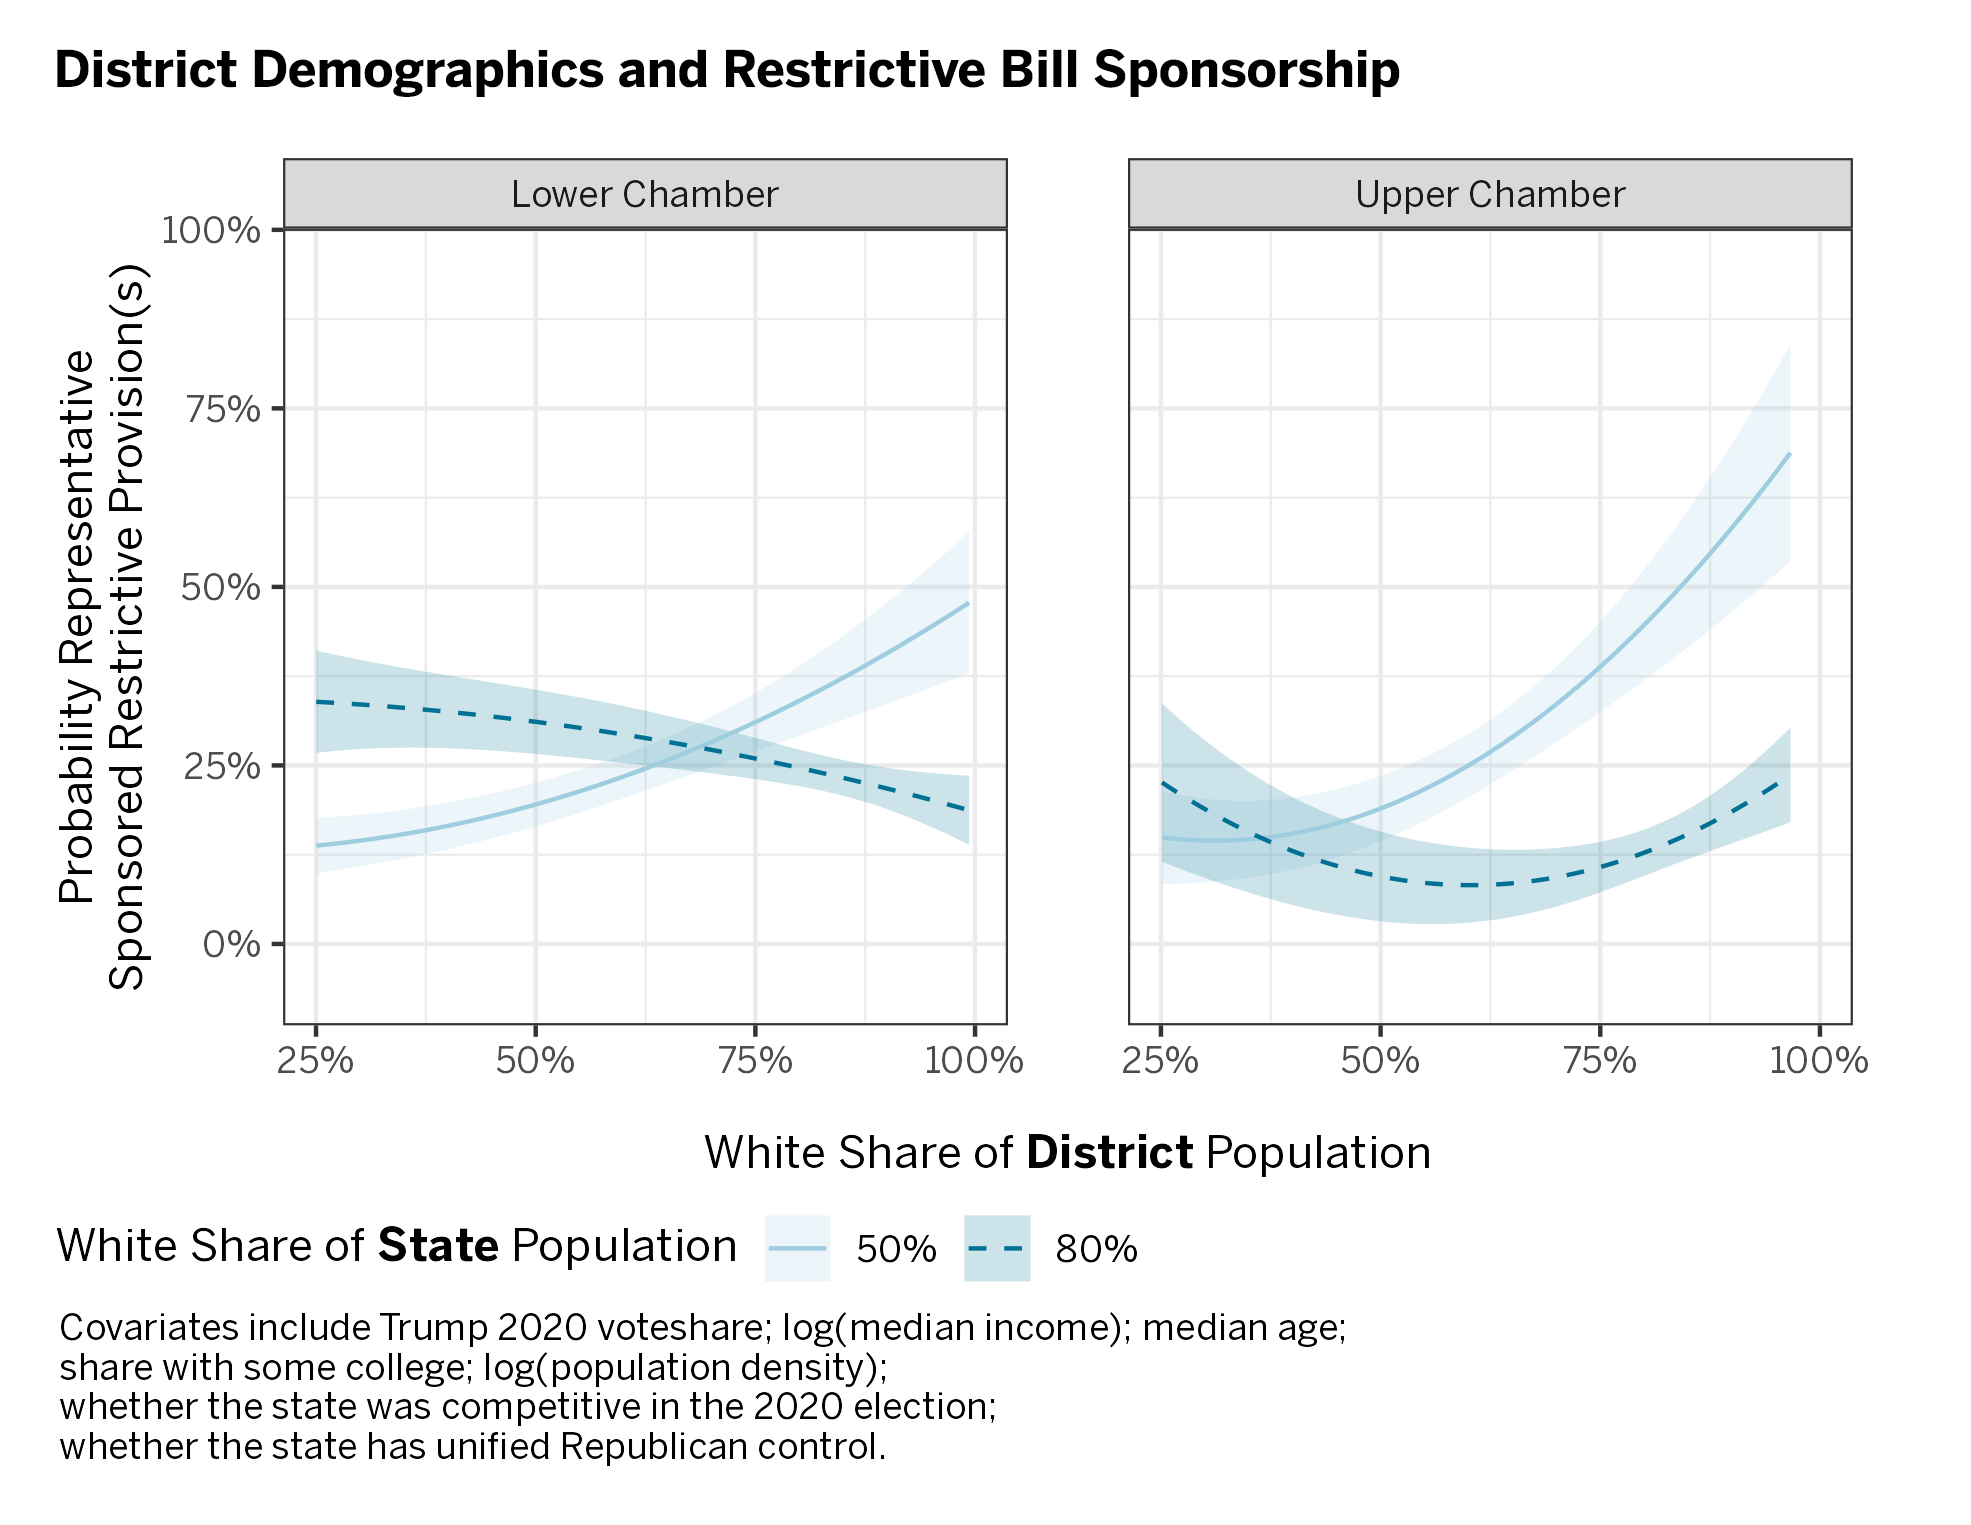
To disentangle these relationships, we use a standard statistical tool called regression analysis. Regression analysis lets us test whether the relationship between race and sponsorship matters even after we account for the independent relationships partisanship and competitiveness have with sponsorship. If everything in the previous figures were explained by partisanship and competitiveness, there wouldn’t be any variation left to explain after accounting for those variables. And if there were no relationship between race and sponsorship, the lines would be flat (or the uncertainty bands would be very wide). If we only have a story of partisanship on our hands, accounting for that should mean that whiter districts are no more likely to be represented by lawmakers sponsoring restrictive bills than less-white districts.

In the next figure, we graphically show these relationships after accounting for other variables.footnote2_u2IURV-sC-MWgdB0IRoJexvEPP7Q4dzefbH4Qxtw_xpXJdDLHUcZK2Throughout, predicted probabilities plots hold other covariates at their means.We do not see flat lines; instead, these relationships look remarkably similar to what they looked like before. While the lines move around a little bit, the same pattern remains: the whitest districts in the least-white states were the most likely to be represented by a lawmaker looking to restrict voting, and the relationship between race and sponsorship was much stronger in these racially diverse states. This means the interplay between district- and state-level racial characteristics systematically influences the likelihood that a district is represented by one of these lawmakers, above and beyond the relationship between party, competitiveness, and sponsorship.

Chart of district demographics and restrictive bill sponsorship

End Notes

Legislative District–Level Results: Racial Resentment and Sponsorship

In the previous section, we showed that whiter legislative districts were considerably more likely to be represented by lawmakers who sponsored restrictive legislation and that this was especially true in racially diverse states. Using regression analysis, we were able to show that the relationship between race and sponsorship remains in racially diverse states even after accounting for other factors like partisanship and competition.

As we mentioned above, recent social science research indicates that whiter areas that are surrounded by racially diverse areas are prone to the politics of white backlash or racial threat. The patterns we observed above are consistent with that narrative. To test how reliable that finding is, we now think about racial backlash in a completely different way. Rather than rely only on demographic data from the census, in this section, we’ll look at how white respondents to a national survey answered questions about the role of race in American life. As we explained previously, we’ll leverage the widely used racial resentment score from the 2020 wave of the Cooperative Election Study.

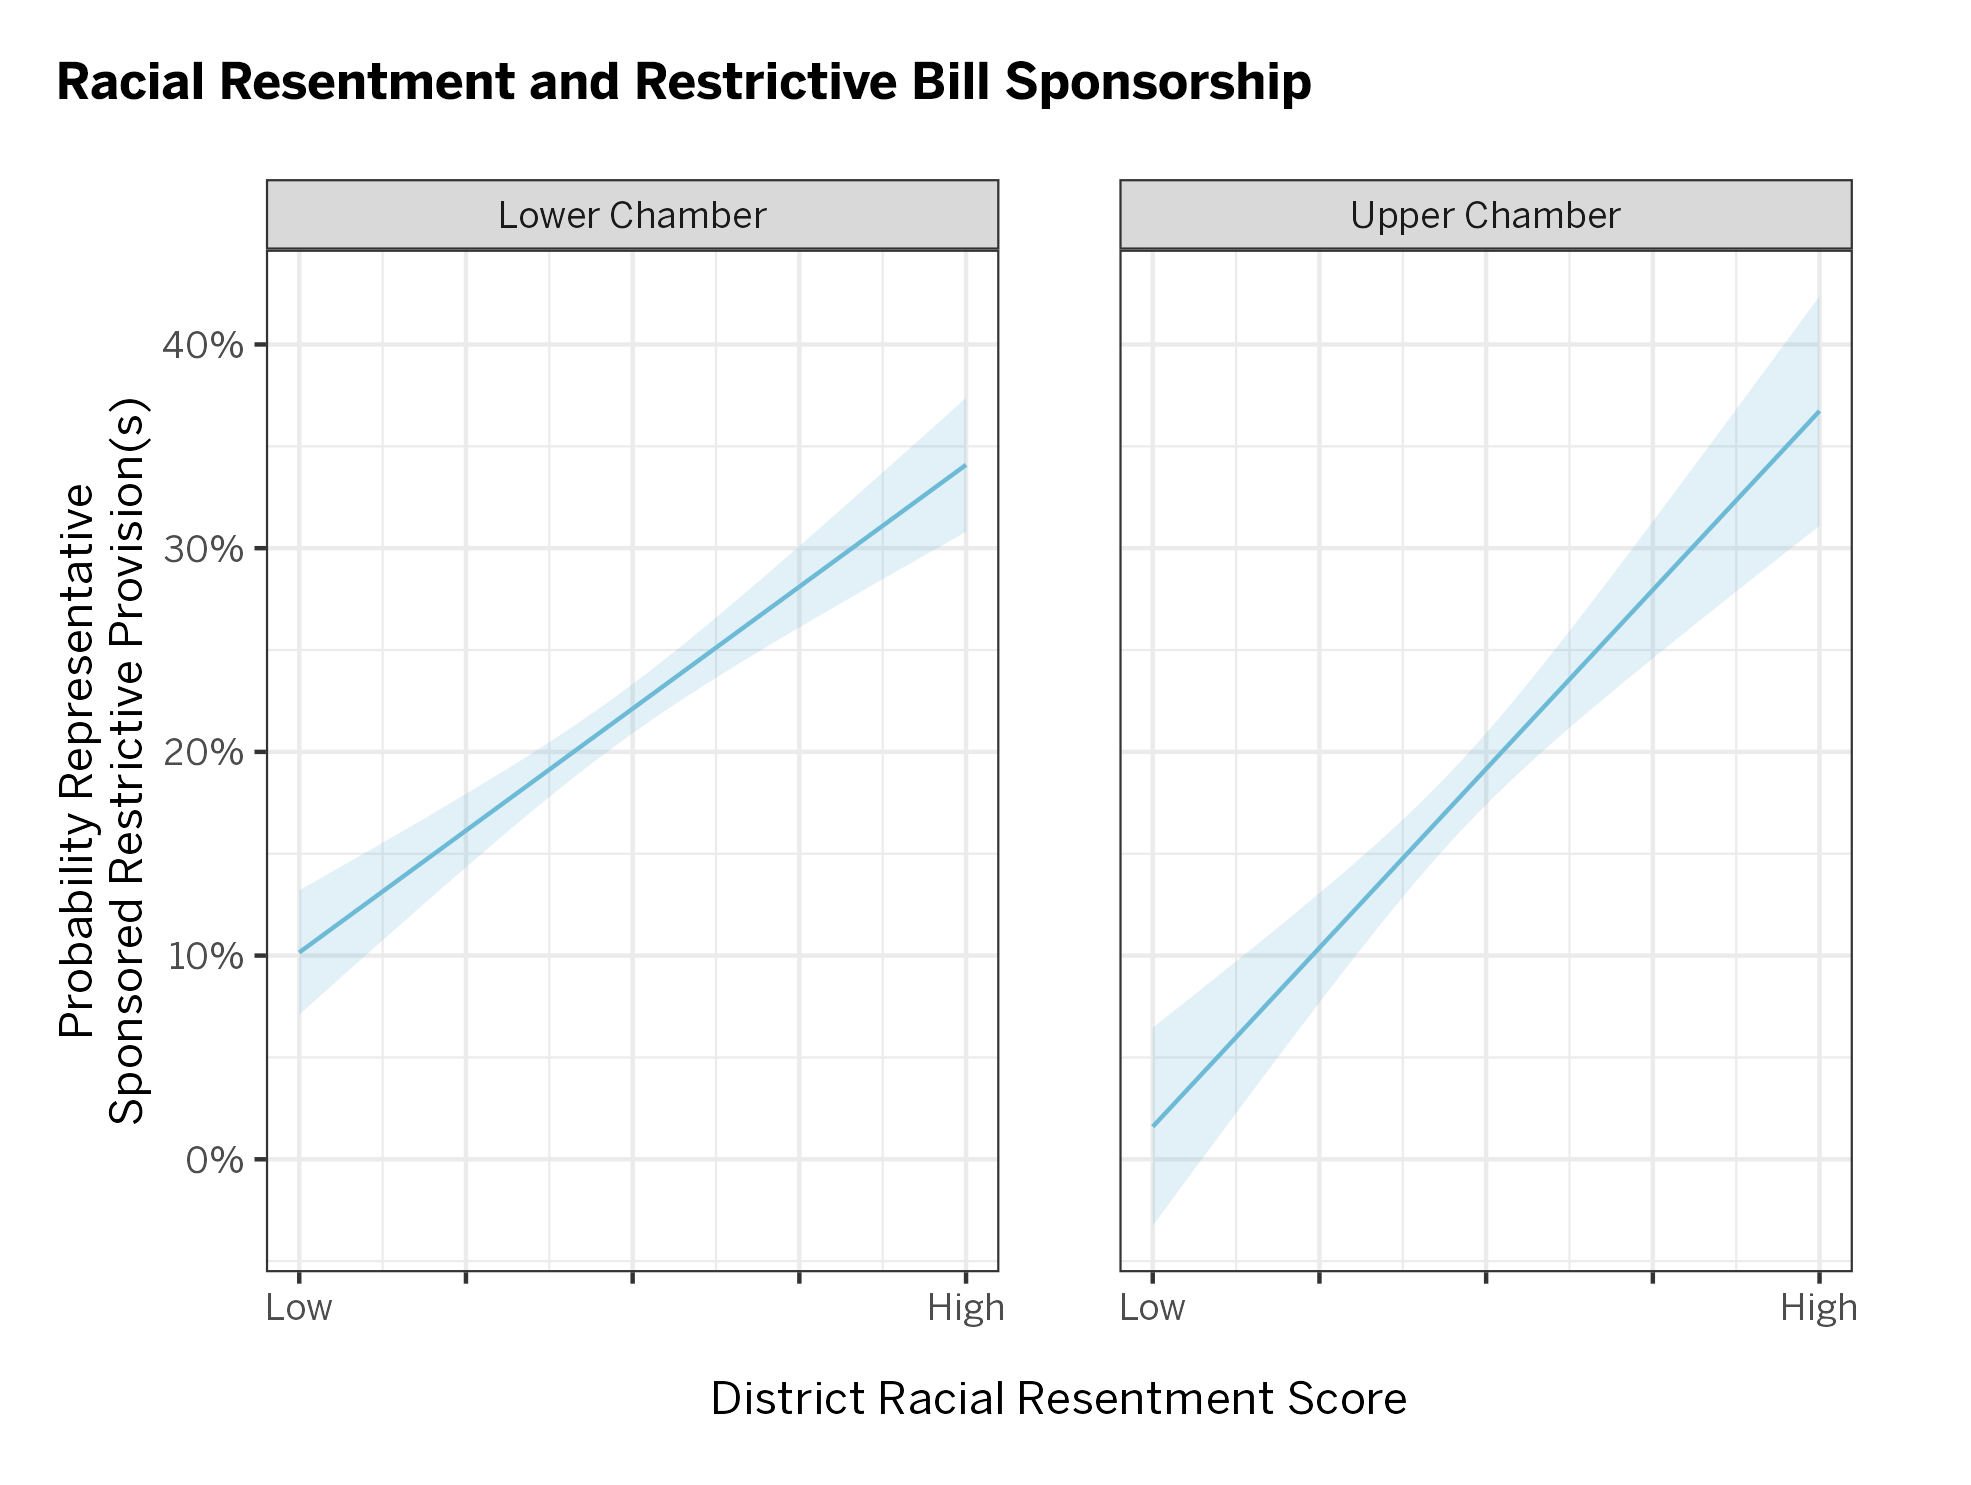
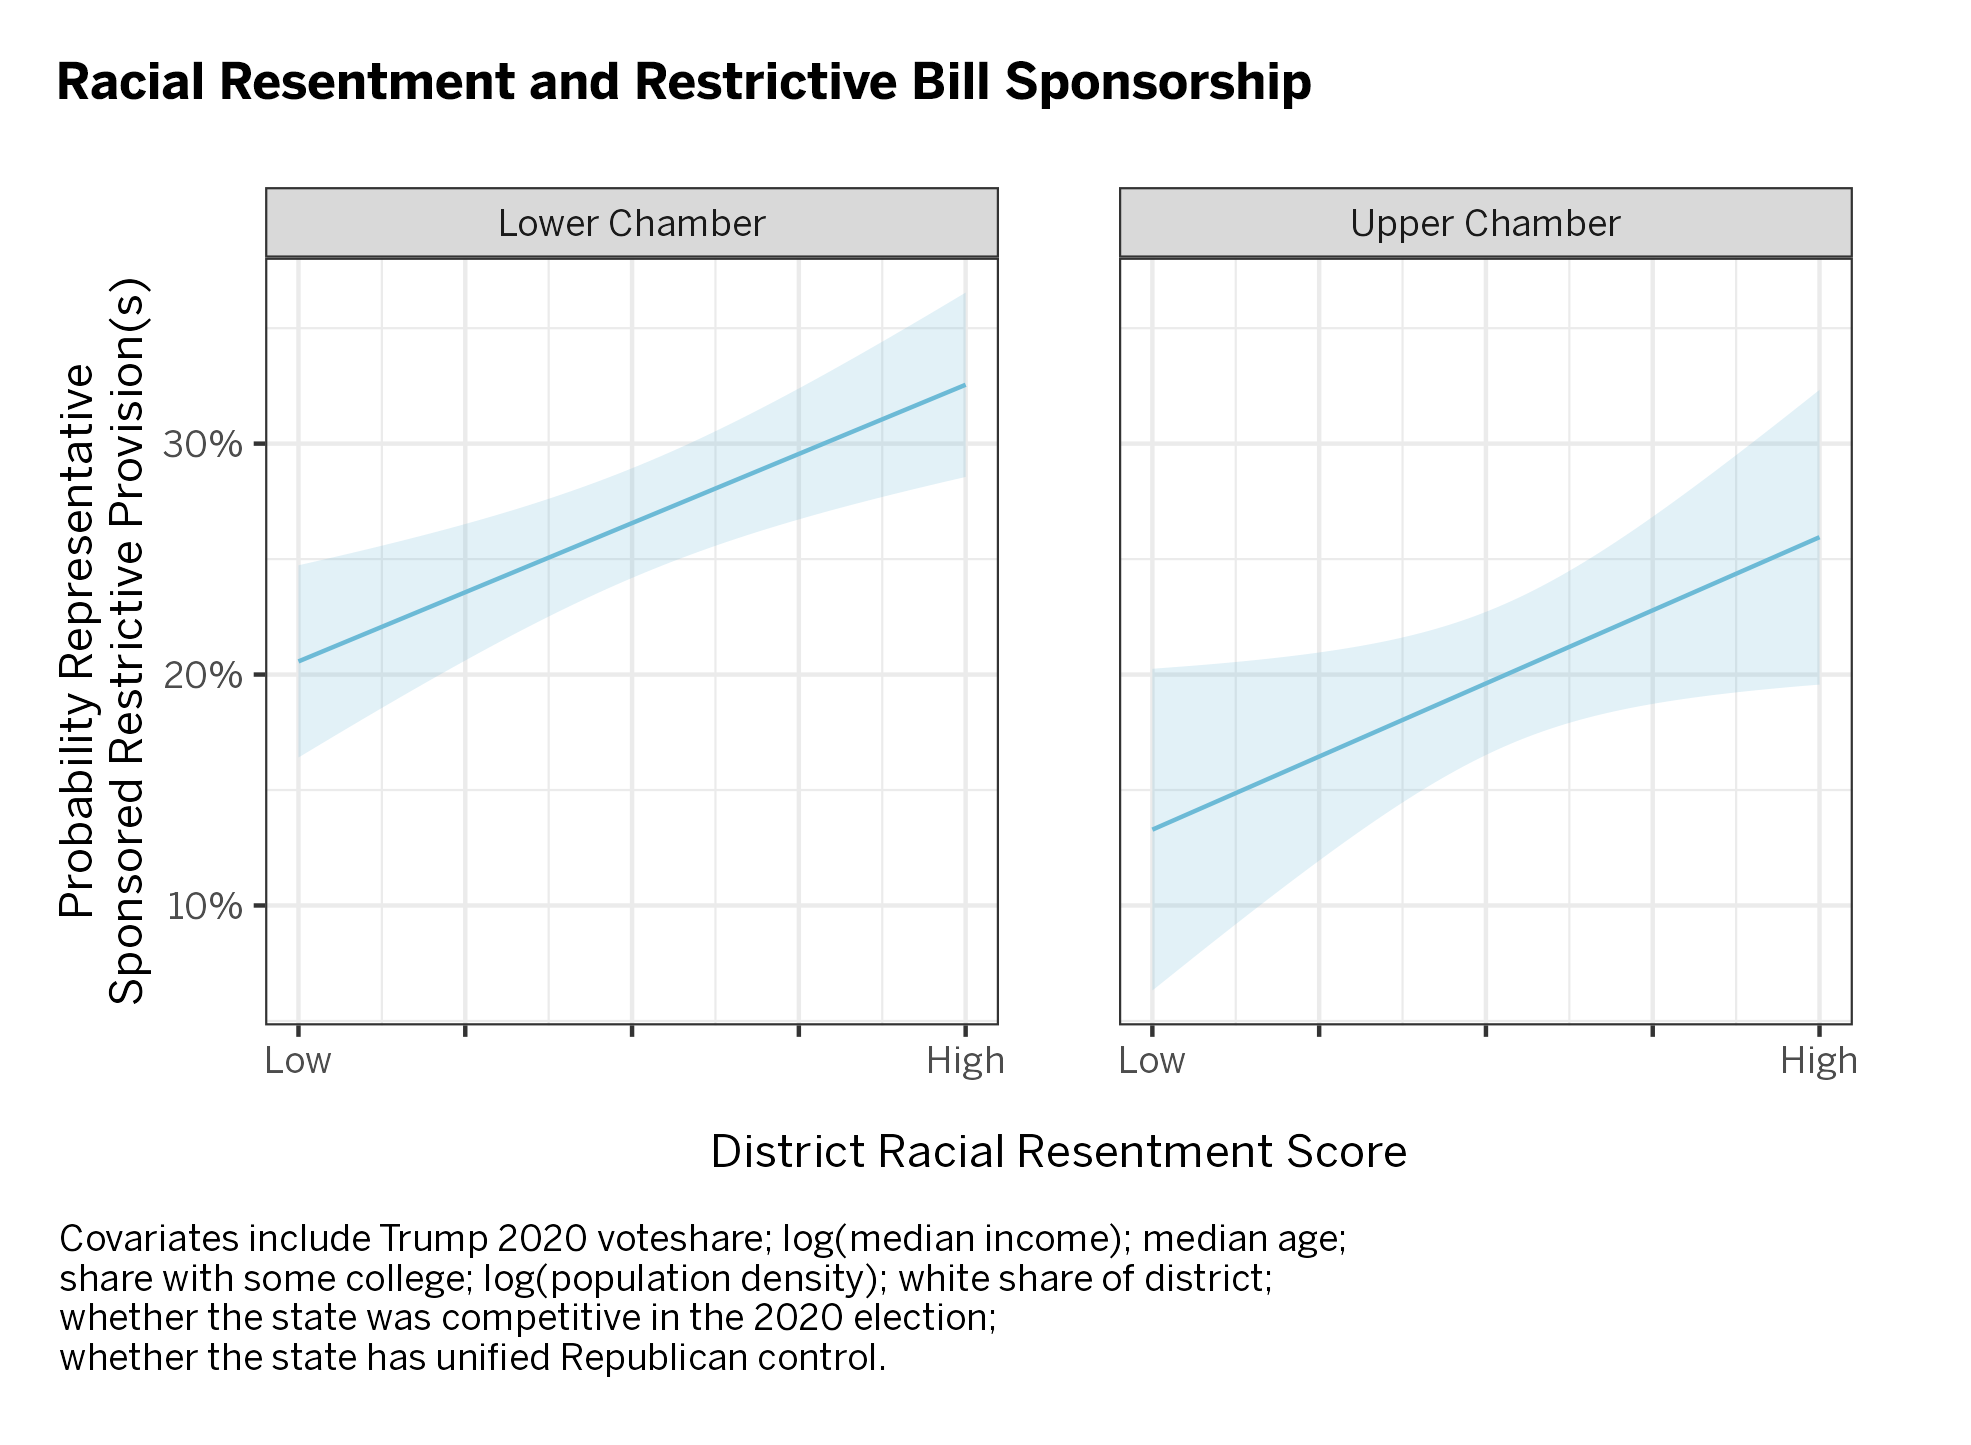
We start, as above, by just graphing the relationship between districts’ racial resentment scores and the likelihood that they were represented by lawmakers who sponsored at least one bill with a restrictive voting provision in it. On the left-hand side of the plot below, we show the relationship in the lower chambers; the right-hand side shows the relationship in the upper chambers.

We see that, on average, districts with higher racial resentment scores were far more likely to be represented by a legislator who sponsored one of these bills. The relationship reaches conventional levels of statistical significance in both the upper and lower chambers. And these slopes are steep, indicating a very strong relationship: the districts with the highest resentment scores were many times more likely to be represented by one of these lawmakers. 

Chart of racial resentment and restrictive bill sponsorship

This same survey, however, shows that race and partisanship are linked with racial resentment — white respondents in the CES who identify as hard-right have much higher racial resentment scores. Once again, we find simple relationships between two characteristics are incapable of saying much on their own. Could it be that white voters score higher on the racial resentment score and are represented by these lawmakers at higher rates, despite no independent relationship between resentment and sponsorship?

To disentangle these relationships, we again turn to regression analysis. As before, if there were no relationship between resentment scores and sponsorship above and beyond what racial demographics and partisan affiliation can explain, we’d expect a flat line (or very wide uncertainty bands) after accounting for those other characteristics. A flat line would mean that districts with high resentment scores were represented by lawmakers who sponsored restrictive bills at the same rate as districts with lower scores, after accounting for the other relevant characteristics of the district.

Chart of racial resentment and restrictive bill sponsorship

And yet, again, we do not see a flat line. The lines are less steep, and our band of uncertainty is wider, meaning that some — but by no means all — of the relationship between resentment and sponsorship is explained by those other factors like partisanship. But the slope of the line remains relatively steep: even after accounting for those other factors, the districts with the highest resentment scores were at least 50 percent more likely to be represented by a legislator pushing a restrictive bill. And, in statistical speak, the uncertainty bands are narrow enough to remain “significant” in both chambers (p < 0.05).

Taken as a whole, these two tests of racial backlash — one looking at demographic information from the census and one looking at survey responses — provide strong evidence that race and racial backlash influenced the sponsorship of restrictive voting bills in 2021, and this influence cannot be explained by partisan factors alone.

State-Level Results

The results so far are clear: representatives from whiter districts in racially diverse states were the most likely to sponsor restrictive legislation in 2021, and this was true for members of the upper and lower chambers. These lawmakers also represent districts with high racial resentment scores.

Now we ask whether there are patterns in the states where these provisions were introduced and passed and whether these relationships are influenced by race and unified Republican control.footnote1_gXyjWYIS5TaB7n5RnTNlQ5ZWceUyme6AgX6rucATLw_qpF2ur61II0z1Although Nebraska’s unicameral legislature is formally nonpartisan, we include it here as a Republican-unified state.The results are consistent with the analysis presented above, and our results are statistically significant even when we use different regression techniques. Restrictive voting rights legislation is shaped by both race and by partisanship.

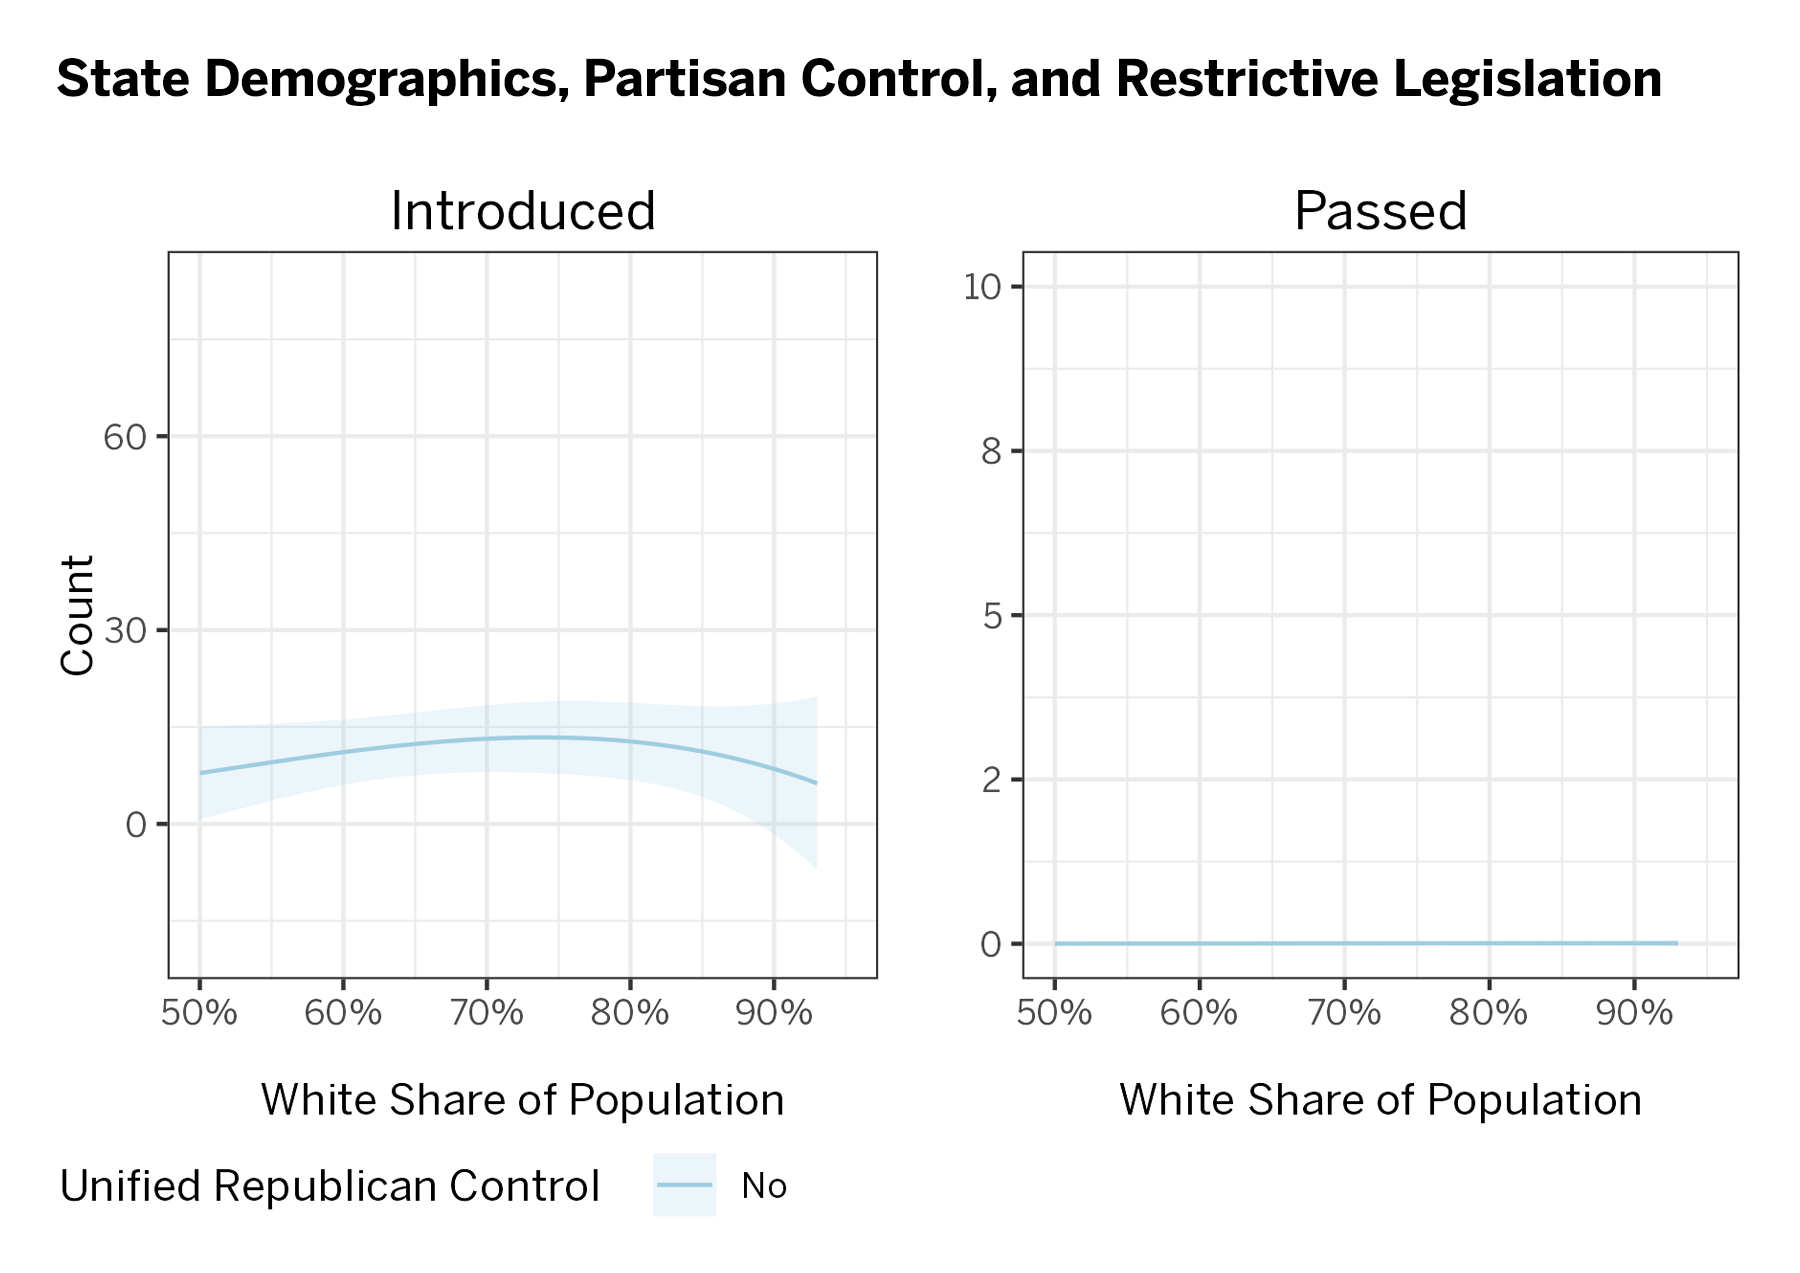
In the figure below, we present the results of a statistical model called “robust regression” (this differs from traditional regression models by giving less weight to outliers — like Texas, for instance, where lawmakers introduced hundreds of restrictive provisions last year).footnote2_Y7Wib9O7oqfwm4zf2soMj-cF3us9aQVx6bAUmXfpU_eKApsvF1Yxx92It’s worth noting that all our results hold even if we simply exclude Texas.Let’s start by looking at the relationship between race and the number of provisions introduced and passed in states where Republicans didn’t have unified control.

Chart of state demographics, partisan control, and restrictive legislation

These lines are flat. In other words: if a state didn’t have unified Republican control, there wasn’t any relationship between race and legislative activity. In fact, these states really didn’t introduce or pass very many provisions at all.

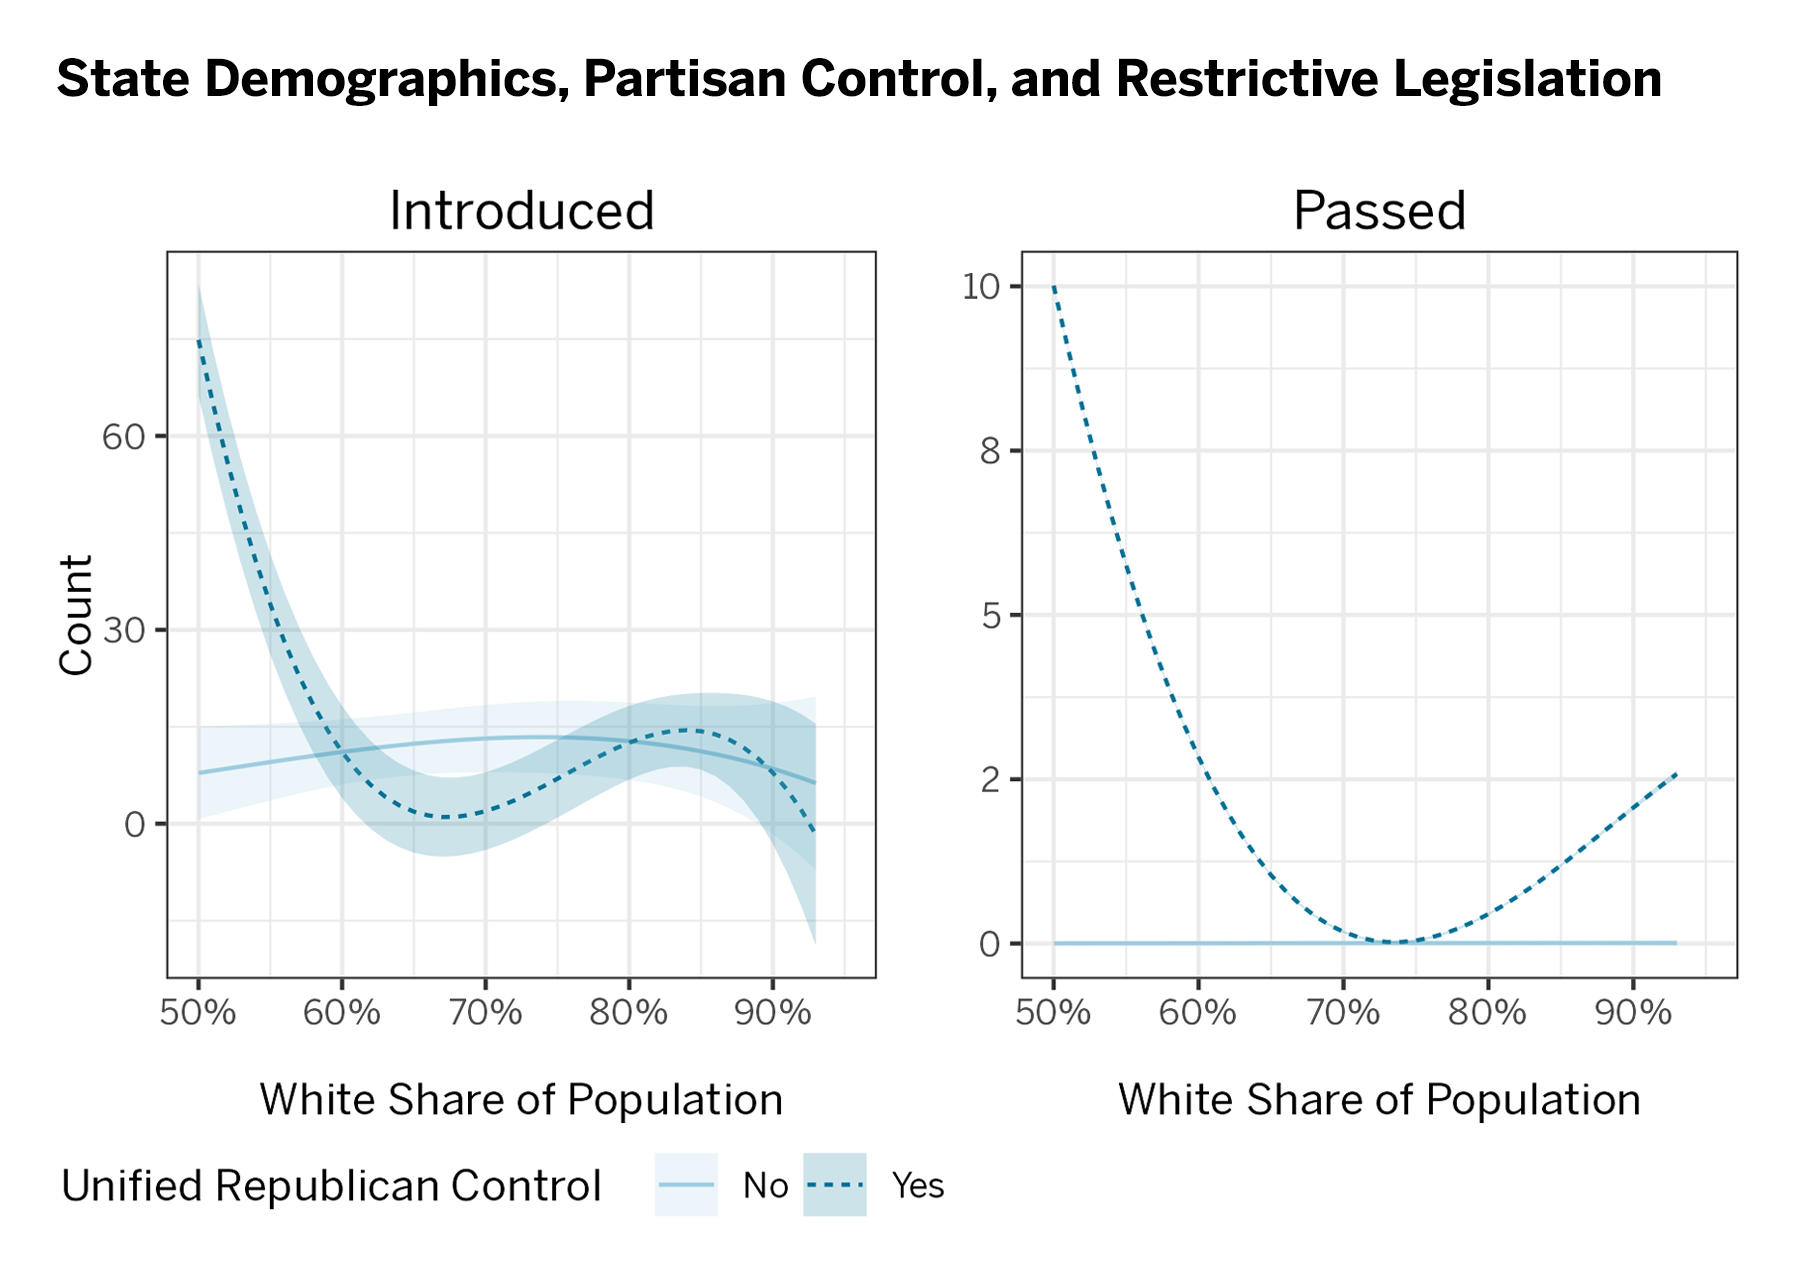
Now let’s add in the states with unified Republican control:

Chart of state demographics, partisan control, and restrictive legislation

In contrast with the states without unified Republican control, there’s a strong relationship between racial characteristics and restrictive activity in states where Republicans hold all the levers of power. Namely, lawmakers in less-white states where Republicans call all the shots introduced and passed far more restrictive provisions.

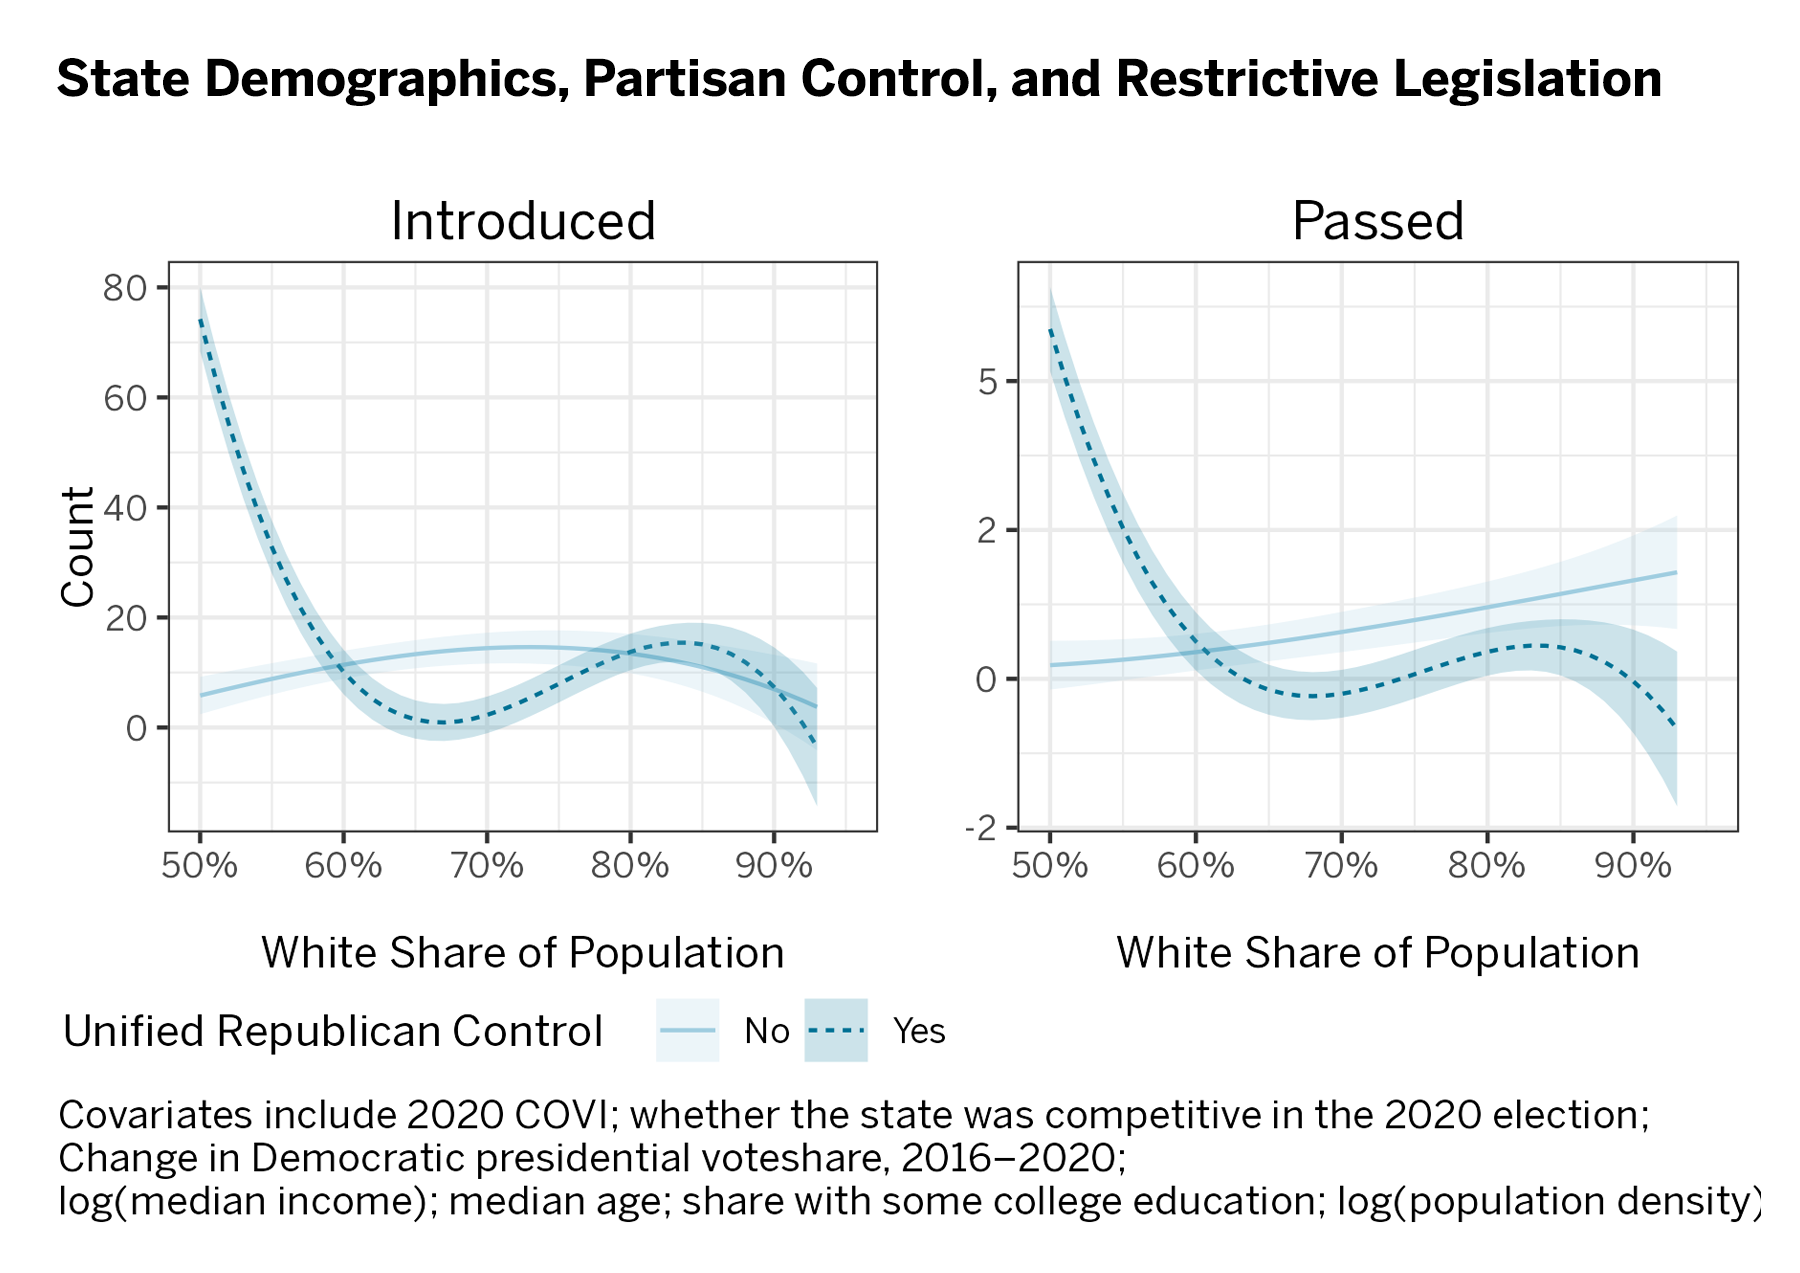
But once again, we’re left with the question of complex relationships. Are less-white Republican states more competitive? Could that competitiveness be driving these relationships? In the next two figures, we revisit these relationships, but as with the legislative district analyses, we statistically account for these other factors.

Chart of state demographics, partisan control, and restrictive legislation

Even after we control for other characteristics, the relationship between race and restrictive legislation persists in the states with total Republican control. How can this be? It turns out that even uncompetitive Republican states saw significant legislative activity, especially when it came to the introduction of these bills. While the four whitest uncompetitive Republican states (Wyoming, North Dakota, Montana, and West Virginia) collectively introduced 28 restrictive provisions in 2021, the four least-white uncompetitive Republican states (Mississippi, Alaska, South Carolina, and Oklahoma) introduced 63 restrictive provisions — more than twice as many. Thus, race seems to be a driving factor for voting rights backlash in Republican-dominated states even when those states aren’t electorally competitive.

End Notes

Conclusion

In recent years, voting rights and access to democracy have become highly partisan issues, with the Republican Party being largely responsible for the wave of legislation restricting access to voting introduced and passed in state legislatures across the country. It is also true that race and partisanship are deeply intertwined. There is strong partisan sorting by race, with the overwhelming majority of Americans of color identifying as Democrats. We therefore might expect that any relationship between the sponsorship of restrictive voting legislation and the racial composition of the constituencies represented by the bills’ sponsors could be explained by the clear partisan divide on the issue.

Our analysis makes clear that this is not the case. The recent trend of restrictive voting laws lies at the intersection of race and partisanship. We are not seeing these bills introduced and passed everywhere that Republicans have control. Rather, they are most prevalent in states where they have control and where there are significant non-white populations. Similarly, it is not just that Republican-leaning legislative districts are represented by lawmakers who sponsor these bills. The sponsorship of these bills is concentrated in the whitest parts of the most diverse states. Further, consistent with established scholarly theories of racial threat, we find evidence that race and racial resentment matter above and beyond the influence of partisanship.

Technical Appendix

Methodology

To explore the drivers of new restrictive voting legislation, we leverage the data from the Brennan Center Voting Laws Roundup Project, which identifies bills introduced around the country with provisions touching on voting access, eligibility, and other issues central to state voting regimes. We use the provisions from each voting bill as it was originally introduced (if it died) or as it was eventually passed. In other words, if a bill is introduced and is later amended to include additional restrictive provisions, but the bill does not pass, these amendments are not reflected in our analyses.

Other Data Sources

In addition to the data on the voting law provisions, we use information from other sources to systematically examine the causes of this wave of legislation. We incorporate information about how hard it was to vote in each state before the 2021 legislative session from the Cost of Voting Index, and we use data from LegiScan to identify the sponsor(s) of each bill. We incorporate data about the racial composition and other sociodemographic indicators of states and legislative districts from the American Community Survey 2020 5-Year Estimates (the latest data available). We control for partisanship by looking at state- and legislative district–level support for Trump in the 2020 presidential election using data from the MIT Election Data and Science Lab and Voting and Election Science Team, respectively.footnote1_AtaHQXwK6Fsiglv4aDlAp34jY-TFPBmBOGIe3mBCXd0_d2RD8kP7Sy3I1We calculate Trump’s vote share for each legislative district by assigning each precinct to the district in which its geographical centroid is located. While this method will not perfectly calculate Trump vote share in some chambers where precincts cross district lines, we have no reason to believe this poses analytical problems.In Kentucky and West Virginia, where precinct-level results are not available, we assign each census block the presidential results of the county in which it falls. District-level results are then calculated as the population-weighted mean of Trump’s vote share of each block in the district. Our results do not change if instead we omit Kentucky and West Virginia. States are considered competitive in 2020 if Trump won between 45 percent and 55 percent of the vote share.

Racial resentment scores are taken from the 2020 Cooperative Election Study (CES). We retain the responses of white voters, and each respondent’s resentment score is calculated as their mean agreement with the following questions: “Irish, Italians, Jewish and many other minorities overcame prejudice and worked their way up. Blacks should do the same without any special favors” and “Generations of slavery and discrimination have created conditions that make it difficult for blacks to work their way out of the lower class” (reverse coded). Respondents to the CES are coded to their home ZIP code. Calculating districts’ racial resentment scores follows the same approach as Trump vote share in Kentucky and West Virginia: we start by assigning each census block the average racial resentment score of the ZIP code in which its centroid falls. District-level scores are the population-weighted mean of each block in the district. Two-thirds of ZIP codes fall entirely within a single upper-chamber district, and more than half are wholly within a single lower-chamber district.

Finally, to account for additional partisan explanations, we identify which states were under unified Republican control in 2021 using data from the National Conference of State Legislators. Observations missing ACS data or precinct-level presidential results are omitted; the relationships are not different when they are included in the models not using these controls.

Regression Tables

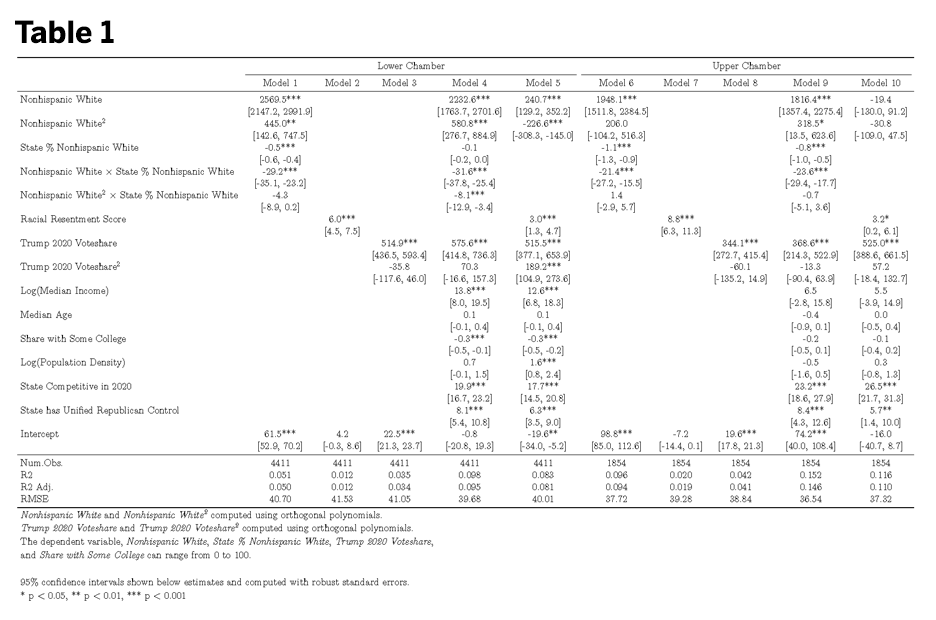
In Table 1, we show the results of the regressions run at the legislative district level. Although partisanship doesplay an important role in the sponsorship of restrictive provisions above and beyond the local and state racial composition, race remains a central force in the sponsorship of these restrictive provisions. In fact, the R2s on the models including only racial demographics are considerably higher than models including only partisan measures in the upper and lower chambers alike. Importantly, as the table and figures above make clear, these relationships are not meaningfully changed by the inclusion of other covariates.

Table 1

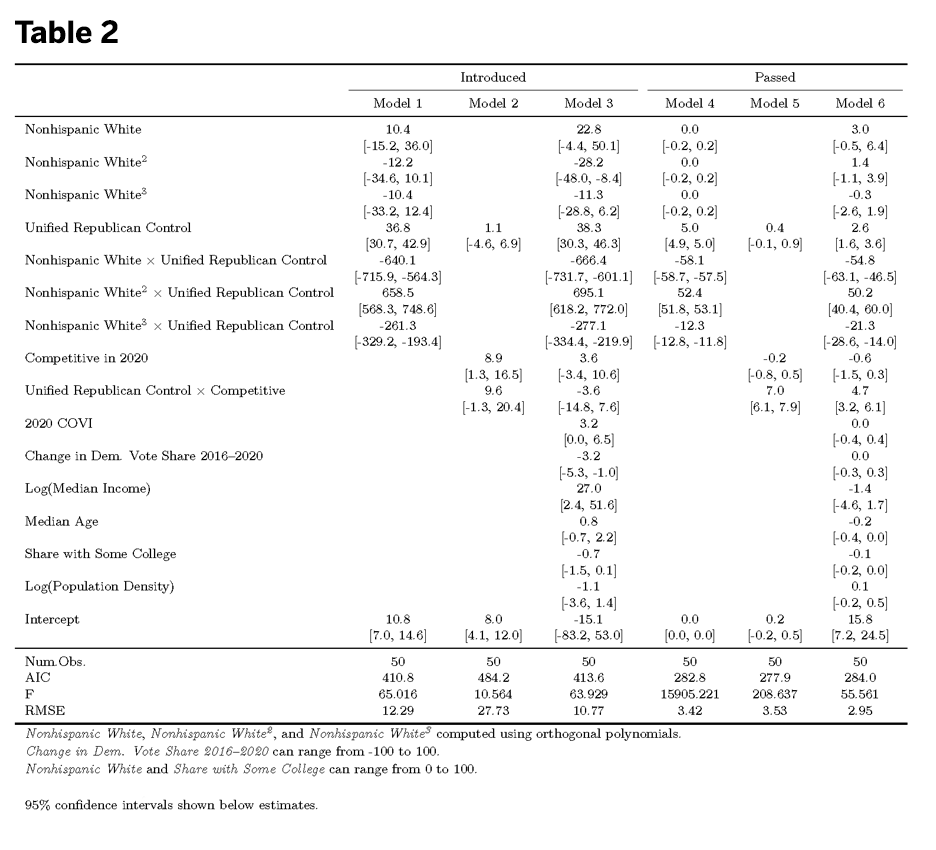
In Table 2, we present the state-level regression table. As discussed above, we use a robust regression (using `rlm()` from the MASS library in R) due to concerns about potential outliers.

Table 2

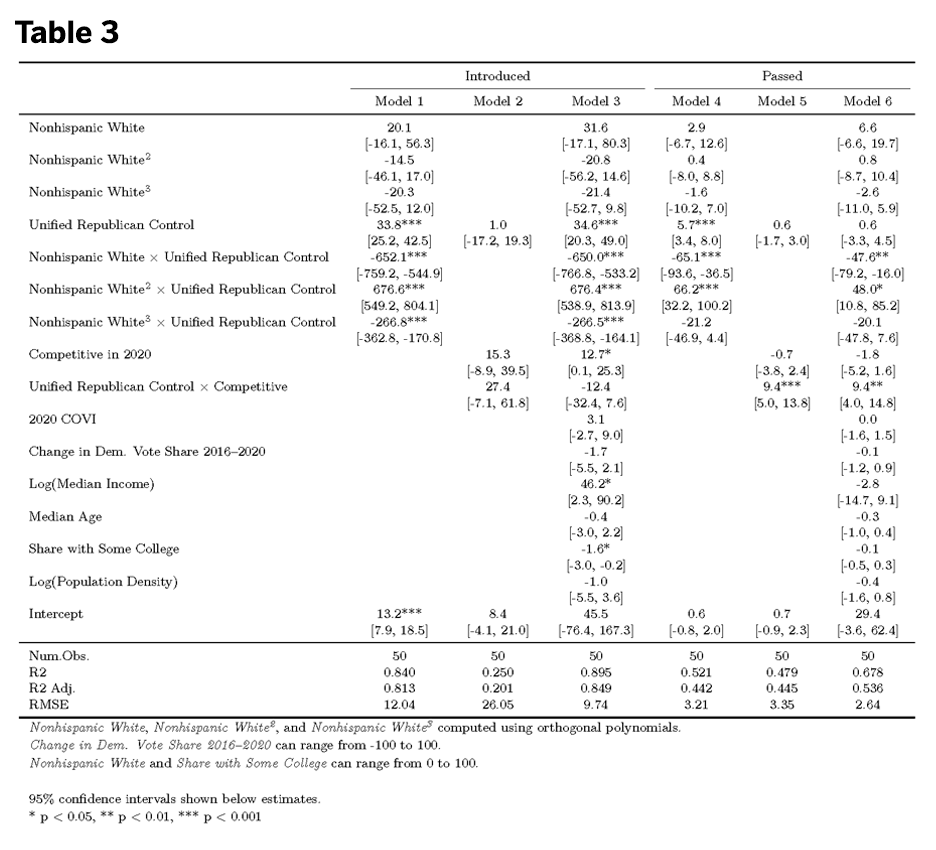
State-level models using OLS are presented in the following table.

Table 3

End Notes