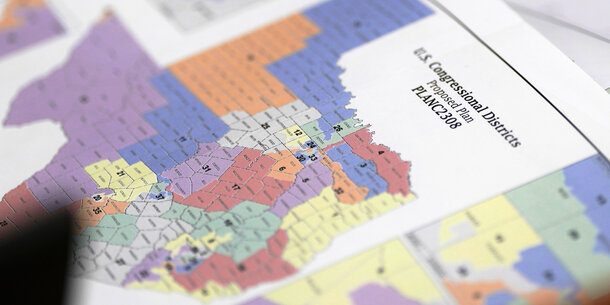
On Thursday, the Supreme Court upheld a gerrymandered South Carolina map that pulled some 30,000 Black voters out of a district to shore up a Republican congressional seat. The Court has previously prohibited maps drawn primarily for racial reasons, but not for partisan ones. In this case, the Court said, the plaintiffs did not show that the district was racially driven, in part because race is often tied to which party a person will vote for.
Writing for the majority in Alexander v. South Carolina State Conference of the NAACP, Justice Samuel Alito cited research published by the Brennan Center from 2021. We showed that the racial turnout gap — the difference between white turnout and that for other voters — was growing around the nation. But it’s necessary to add some clarity to Alito’s thinking about what this finding means.
Alito acknowledges the correlation between partisanship and race, which is quite prevalent in Southern states like South Carolina. But then he asks, “Why would [the state mapping expert] have used racial data . . . as a proxy for partisan data when he had access to refined, sub-precinct-level political data that accounted for voter turnout and electoral preferences?”
The answer is simple: the “refined, sub-precinct-level” race data is available in South Carolina from the state’s registered voter file. South Carolina is one of only a handful of states where voters self-report race when they register. But voters in South Carolina do not register with political parties, so there is more precise information available on race, but not party affiliation. The voter file does, however, indicate which partisan primary an individual voter participates in. While this is a good proxy for partisanship in South Carolina, it is not as reliable as self-identified partisan affiliation — and it provides no insight for the many registered voters who do not vote in primaries.
Alito accepts that race could be a better predictor of vote choice than party affiliation in South Carolina, but he cites our study to speculate that lower relative turnout of nonwhite voters probably renders racial data unhelpful in map drawing. Quite the opposite. Individual voter files in South Carolina include race data, and they show how often every registered voter participated in elections since the 1990s. This data allows map drawers to account for differential turnout by race and to predict future turnout with precision.
Put plainly, an ideal place to predict a party nominee’s likely votes in South Carolina is in exactly the sort of place the evidence indicates the state looked: files with racial data. Although the transcripts from the trial court focus on whether the state used aggregate levels of Black voting-age population, the voter files are widely used in the map-drawing process around the country. Alito’s concession that the state had in fact viewed this data, despite claims that it never considered race at all, is of greater consequence than he lets on.
Also puzzling is the opinion’s decision to rely on our online post from 2021 rather than the more comprehensive report we published on this topic just months ago. In the report, we analyzed a more robust set of data. Namely, individual vote records from the nearly 1 billion votes cast in federal general elections from the 2008 to 2022 elections. This report detailed the growing racial turnout gap we showed in 2021. It also noted a primary diver of the growing racial turnout gap: the Supreme Court’s decision in Shelby County v. Holder. Prior to 2013, Section 5 of the Voting Rights Act required states like South Carolina with histories of racial discrimination to “preclear” any changes to their voting policies with the federal government before they could go into effect. In 2013, the Supreme Court decided to effectively end the preclearance regime. Our report showed that, on average, the racial turnout gap grew twice as fast following the decision as it would have otherwise in the counties that had been subject to Section 5.
South Carolina provides a clear example of how these broader trends have developed over the past generation. Below, we plot the white—nonwhite turnout gap in South Carolina versus the rest of the country. The South Carolina turnout gap trailed the rest of the country during the Obama years. Since 2014, however, the South Carolina’s gap has grown more quickly than in the rest of the country — and, in 2020 and 2022, it was actually higher than the rest of the country. And, as the second figure shows, the gap is growing more quickly in Charleston County — home of the legal issue in Alexander — than in the rest of South Carolina.
Not all this growth is attributable to the Supreme Court’s decision in Shelby County v. Holder, but the evidence is strong that the ruling played a significant role in widening the gap. South Carolina has a large Black population, which means the turnout gap likely would have grown when Obama left office even if Section 5 were still in force. Nevertheless, we used multiple tests to show that Shelby County likely had a causal effect on the turnout gap in South Carolina and other states that had previously been subject to preclearance. Without that requirement, state legislatures and local officials have been free to adopt new antidemocratic policies, including redistricting.
In sum, we agree with Alito when he noted that “non-white voters turn out at a much lower rate than white voters.” But his conclusion that this fact means that racial data cannot be used to draw maps that could discriminate is simply not the case. What this data can and does establish, however, is that the Court’s retreat from protecting voting rights for people of color has resulted in increasing gaps in participation in places like South Carolina.


