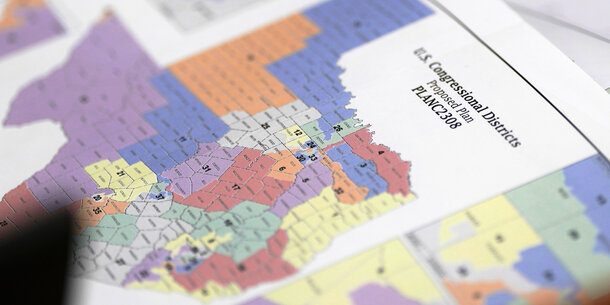
Under the proposed Freedom to Vote Act (FTVA), a congressional redistricting plan is considered to have excessive partisan bias if one party has an advantage of more than 7 percent of the state’s seats in comparison to seats won under a neutral benchmark based on the vote in the two previous presidential and U.S. Senate elections. In states with 14 or fewer seats, the threshold requires an advantage of only one seat, and the threshold increases from there as the number of seats in the state increases beyond 14.
To analyze plans, the FTVA calls for use of “standard quantitative measures of partisan fairness that relate a party’s share of the statewide vote to that party’s share of seats.” For this study, we used the simplified efficiency gap, one of the central measures of partisan bias in the social science literature and a measure specifically mentioned and sanctioned by the FTVA. We began our analysis with the Democratic share of the two-party vote in the recent statewide federal elections specified in the FTVA. To estimate the number of seats that the Democratic statewide candidates in those elections would have carried under maps with no partisan lean (i.e., when the efficiency gap is zero because votes are distributed with perfect efficiency), we plug in the Democratic candidate’s vote share into a formula relating seats and votes (see Equation 2 in Eric McGhee’s 2017 paper, though we solve for seats). We then compared the actual number of seats carried in a given plan by Democratic statewide candidates to this neutral baseline. The difference between the actual seats and the neutral baseline is our indicator of partisan bias in the district plan and triggers the FTVA presumption of excessive partisan bias when the difference exceeds the thresholds described above.
In total, 19 states that have enacted plans that trigger the FTVA presumption of partisan bias were analyzed: Arizona, Connecticut, Florida, Georgia, Illinois, Indiana, Iowa, Massachusetts, Missouri, New Jersey, New Mexico, North Carolina, Ohio, Oregon, South Carolina, Tennessee, Texas, Utah, and Wisconsin. The FTVA test for a presumption of partisan bias was applied to simulated redistricting plans created by the Algorithm-Assisted Redistricting Methodology (ALARM) Project to put the results of these partisan gerrymandered maps into context with viable neutral plans. The ALARM Project is based at Harvard University and led by Professor Kosuke Imai. The project has generated a large set of simulated congressional district plans for each state. Data from the ALARM Project included 5,000 simulations for each state except for Utah, which included 6,000 simulations. This analysis provides important insight into how frequently FTVA-compliant maps occur within the data.
The ALARM Project provided data on each simulated plan, including vote totals for the Democratic and Republican candidates within each district from four recent statewide elections. The elections included are the 2016 and 2020 presidential elections and the two U.S. senatorial elections that occurred in each state between 2016 and 2020. The election results were fit into each of the simulated plans to determine the number of Democratic and Republican seats that would have been won if that simulated congressional redistricting plan were enacted.
For each test election under a simulated plan, the number of districts in which the Democratic vote total exceeded the Republican vote total was considered the actual number of seats Democrats would win under the simulated plan. We estimated the proportion of plans that did not trigger the presumption of partisan bias in each state. In a special case, the Tennessee simulations did not include data on vote totals from the 2018 U.S. senatorial election. Therefore, seat differences for two out of three elections needed to exceed the threshold for a simulated plan in Tennessee to trigger the FTVA presumption of partisan bias. All plans that triggered the FTVA presumption of partisan bias were eliminated.
Additional analysis was conducted on the simulated plans that did not trigger the FTVA presumption of partisan bias to estimate what a fair redistricting plan would look like in each state. This analysis specifically focused on the number of districts carried by Democratic presidential candidate Joe Biden in the 2020 presidential election. The median number of Biden seats in the set of fair plans was determined for each state. These values were then compared to the number of districts that Biden won according to the enacted 2024 plan. In addition, distributions of the number of Democratic seats won in each of the fair plans based on the results of the 2020 presidential election were determined in each state. Overall, this further analysis, which only included the fair simulated plans, provides additional insight into what a fair redistricting process may look like in states with enacted plans that trigger the FTVA presumption of partisan bias.

