Our analysis reveals two divergent stories.
There is positive news for supporters of fair districts. In many states, maps are much fairer than after the 2010 census, when single-party control of the redistricting process as a result of the midterms gave partisan line drawers free rein to craft some of the most extreme gerrymanders in American history.
This redistricting cycle has seen notable improvement. State-level redistricting reforms in once-gerrymandered states (Michigan and Virginia), the increased willingness of state courts to enforce limits on partisan gerrymandering (Maryland), and electoral victories resulting in divided government (Pennsylvania) all have helped create fairer maps.
Despite the improvement in some states, single-party control of the redistricting process remains the norm in much of the country. In these states, partisan map drawers have been able to continue to manipulate the process to engineer outsize advantages for the party in charge. The large and fast-growing South has been especially prone to abuse.
North Carolina provides a vivid example. With an electorate that is just about evenly divided between the two major parties, the Tar Heel State is regularly among the most electorally competitive in the nation. Under a map put in place by state courts, voters elected 7 Democrats and 7 Republicans to the House in the 2022 midterms. But a new conservative majority elected to the state supreme court dismantled the anti-gerrymandering protections put in place by its predecessor. With the freedom to redraw maps to their pleasure, GOP lawmakers quickly replaced the more equitable court-drawn map with a wildly gerrymandered one. This year, that new map could see the perennial battleground state elect as many as 11 Republicans and just 3 Democrats — a radically skewed result in a state that is shaping up to be a 2024 presidential battleground.
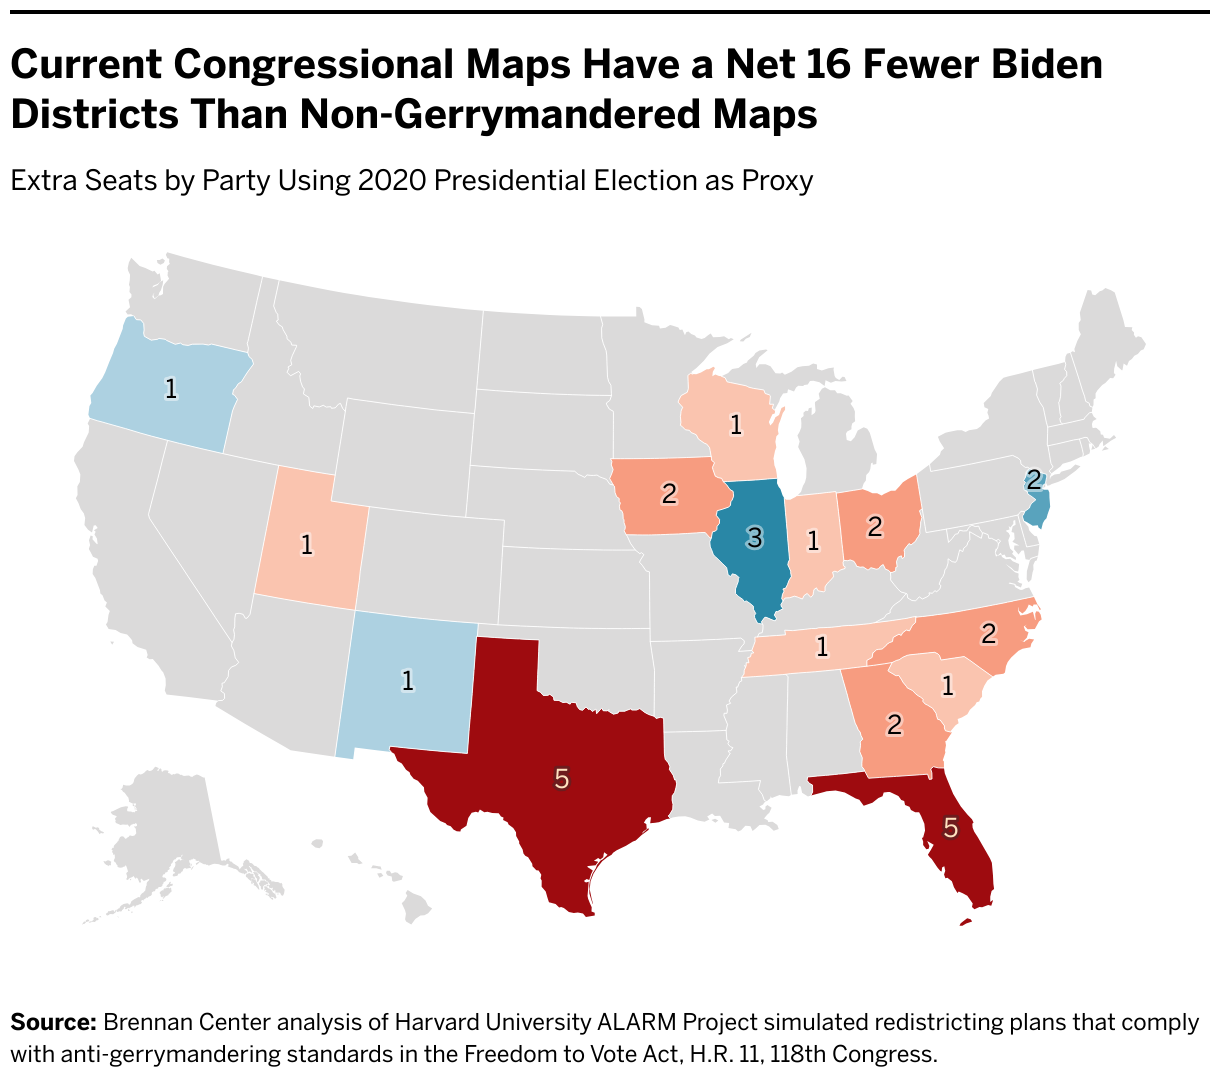
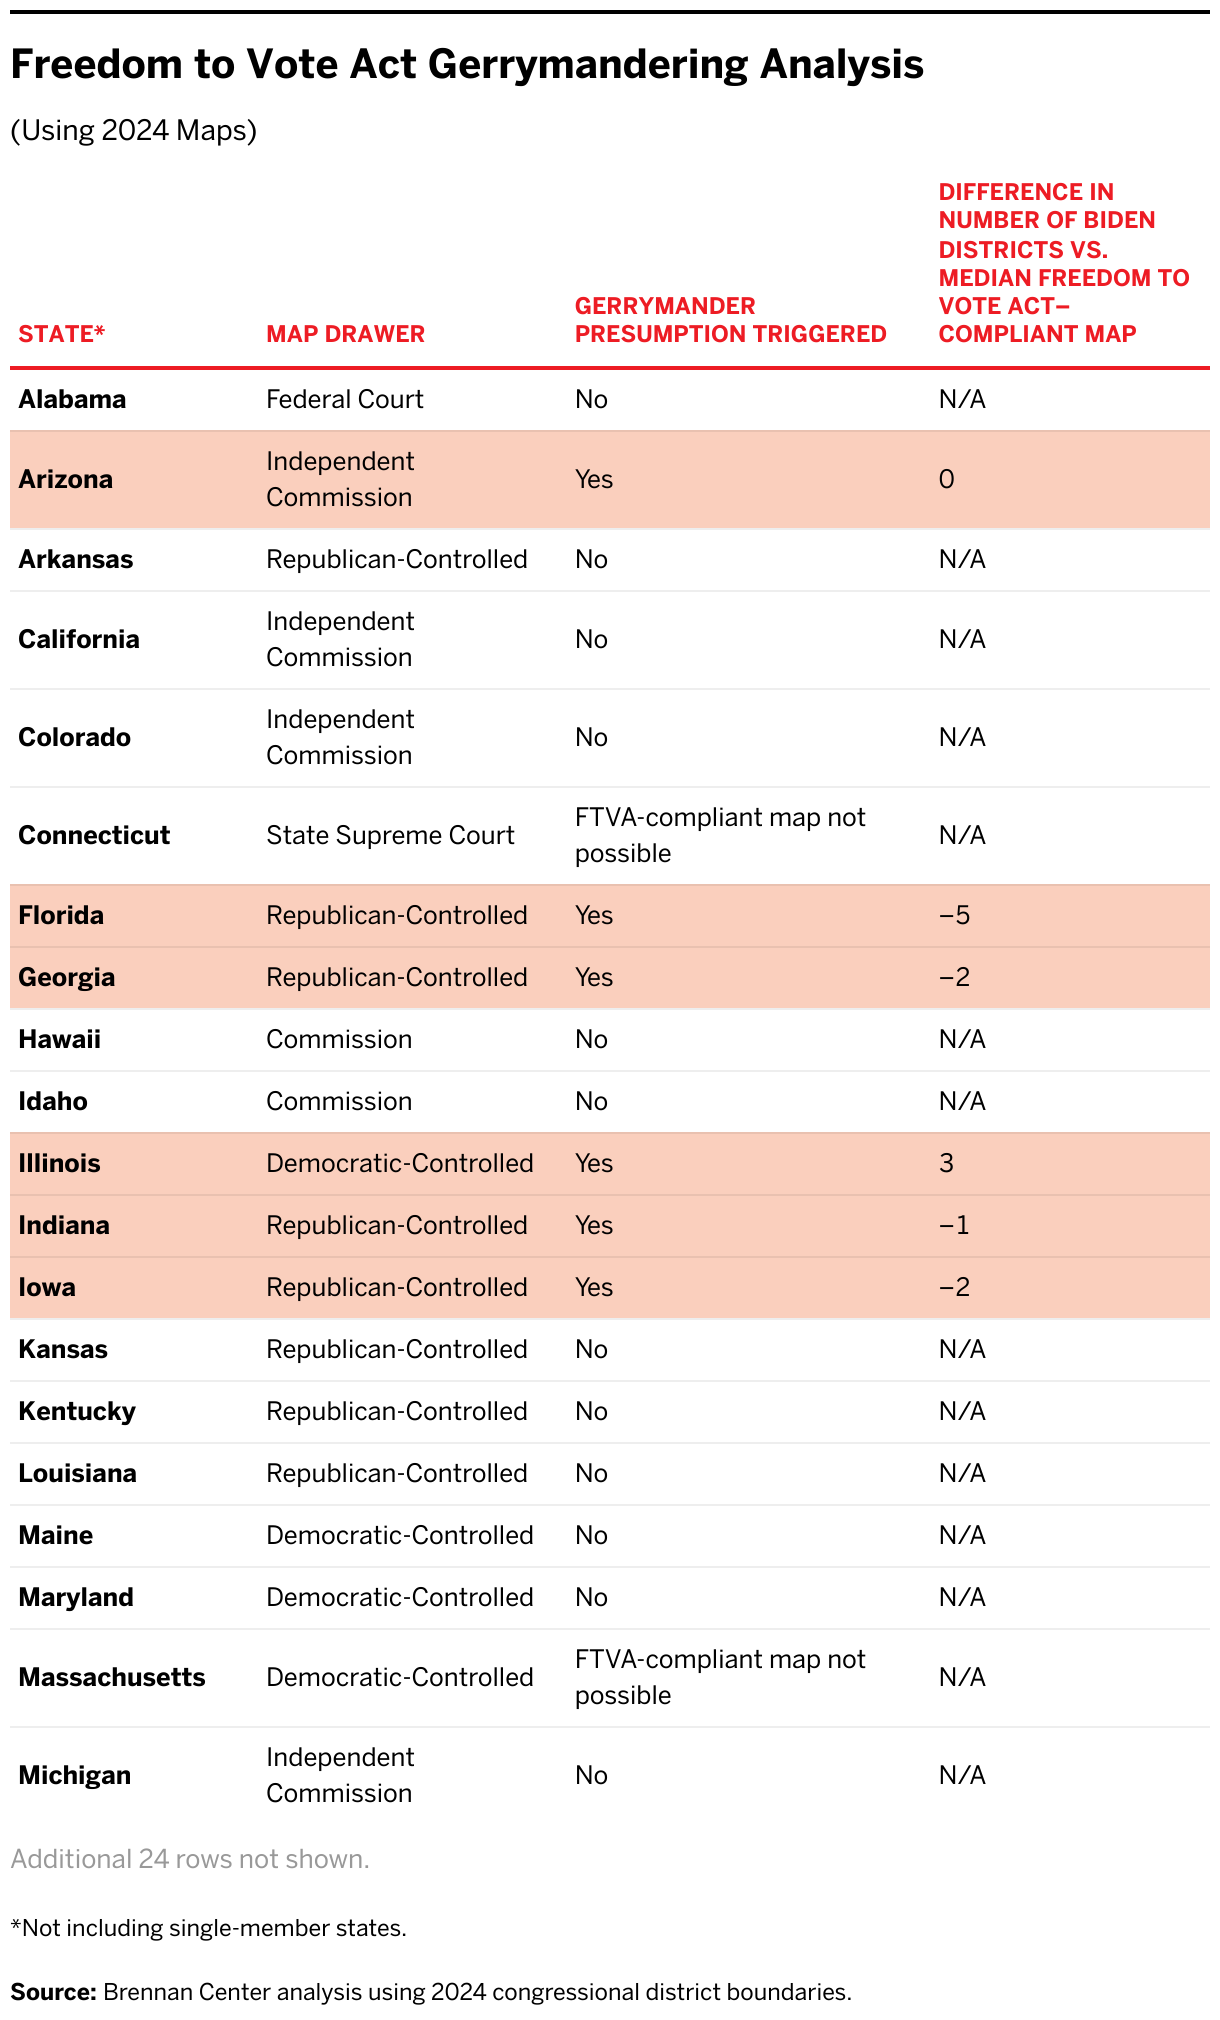
In total, our assessment showed that the proposed Freedom to Vote Act’s presumption of extreme partisan bias would have been triggered in 19 states: 11 where Republicans drew maps, 4 where Democrats drew maps, 2 where commissions drew maps, and 2 with court-drawn maps.
In all but two states, there were hundreds and, in most cases, thousands of alternative maps that would not have been categorized as partisan gerrymanders. In Illinois, for example, a state with a Democratic gerrymander, over 99 percent of alternative maps in the ALARM set satisfied the Freedom to Vote Act. In Texas, a state with a Republican gerrymander, more than 84 percent of alternative maps were compliant. In these states, map drawers had no shortage of alternatives had they wanted to adopt a fair map. They had to go out of their way not to do so.
The Republican Gerrymanders
Texas and Florida, the two states that gained the most congressional seats this decade, anchor the GOP advantage in this decade’s maps. In 2024, these two big states alone give Republicans a total of 10 additional safe House seats compared to the median Freedom to Vote Act–compliant map.
In Texas, Democrats currently hold only 13 of 38 seats (34 percent) despite getting between 46 and 48 percent of the vote in recent statewide federal elections. The median Freedom to Vote Act–compliant map, by comparison, has 18 Democratic districts (roughly in line with Democrats’ recent statewide vote share).
Critically, gerrymandering in the Lone Star State also created an electoral firewall for Republicans: 21 of the 25 Texas seats they hold are districts that Donald Trump carried by 15 or more percentage points in 2020. This is a significant change from last decade’s maps, in which there were only 11 such super-Trump districts.
In Florida, Republicans undertook an even bigger seat grab, transforming a 16–11 edge in the state’s congressional delegation into an astonishing 20–8 advantage. They accomplished this feat by making the district Florida picked up in reapportionment a Republican seat and targeting three Democratic incumbents, including a Black Democrat in northern Florida. By contrast, the median Freedom to Vote Act–compliant map has 13 Democratic seats. No Florida congressional races are currently rated as competitive.
The next biggest building block in Republicans’ advantage is North Carolina. The median Freedom to Vote Act–compliant map has 6 Democratic seats, but the state’s newly gerrymandered map could see the election of just 3 Democrats in 2024. Only one North Carolina district — a newly gerrymandered district long represented by a Black Democrat — is rated as competitive this year.
Republicans also drew a skewed but marginally more competitive map in Ohio that produced a 10–5 split in 2022 but could produce a 12–3 split this year if Republicans pick up two currently Democratic-held toss-up districts (including one that they likely lost in 2022 only because the Republican candidate lied about his military record). By contrast, the median Freedom to Vote Act–compliant plan has 6 Democratic districts.
After these four states, the Republican advantage is rounded out by gerrymanders in a handful of other states.
In Indiana, Iowa, South Carolina, and Utah, map drawers used the redistricting process to shore up their position by transforming once-competitive GOP-held districts into much more reliably Republican ones.
GOP lawmakers in Tennessee and Georgia were even more aggressive. In Tennessee, Republicans gained a seat after redistricting due to the division of diverse and heavily Democratic Nashville among three districts, eliminating what had long been a safe Democratic seat. A variant of the same maneuver happened in Georgia. There, a federal court ordered lawmakers earlier this year to redraw the map to create an additional Black-majority district. Lawmakers did so, but they offset the creation of that new, all-but-certain Democratic district by dismantling a diverse, multiracial coalition district elsewhere in metro Atlanta and creating a safe Republican district in its stead. As a result, Republicans are guaranteed to keep a 9–5 advantage in the state’s congressional delegation. By contrast, the median Freedom to Vote Act–compliant map in Georgia has 7 Democratic districts. No districts in either state are currently rated as competitive.
The final state that gives Republicans some advantage is Wisconsin, albeit a comparatively weaker one. There, legislative deadlock left the state without a map. The state supreme court stepped in to select a map, adopting a “least change” approach that left in place a Republican gerrymander from the prior decade. In 2022, that map produced a 6–2 Republican advantage in the state’s congressional delegation, though one Republican seat is relatively competitive. By comparison, the median Freedom to Vote Act–compliant map has 3 Democratic or Democratic-leaning districts.
The Democratic Gerrymanders
In almost all the states where Democrats controlled the redistricting process, they already held all or nearly all the seats, leaving them few options to increase advantages through gerrymandering. The gerrymanders they produced are also far less reliable than those drawn by Republican counterparts, with Democratic advantages often coming in the form of Democratic-leaning competitive seats rather than safe districts.
The biggest Democratic offset to Republican gerrymandering is in Illinois, where Democrats were able to take an existing gerrymandered map and tweak it to shore up incumbents and pick up an additional seat in the southern part of the state, giving them a remarkable 14–3 edge. Under the map, Republicans have fewer than four seats in Illinois for the first time since before the Civil War. The median Freedom to Vote Act–compliant map, by contrast, has 6 Republican seats.
Democrats also drew maps in New Mexico and Oregon to pick up an additional seat in each state, but their gerrymanders are much weaker than the fortress gerrymanders Republicans drew in states such as Texas.
In Oregon, Democrats attempted to engineer a 5–1 advantage by making one Republican-leaning district into a Democratic-leaning swing seat. But Republicans managed to win it anyway in 2022, resulting in a 4–2 split. The seat remains competitive this year. Similarly, in New Mexico, Democrats attempted to draw a map where they would win all three of the state’s congressional districts. It worked, but just barely, with the party winning the state’s third seat by less than a percentage point in 2022. This year, that district is again rated as a toss-up. The median Freedom to Vote Act–compliant plan has 2 Republican seats in Oregon and 1 in New Mexico.
New Jersey is the final state that gives Democrats an advantage, although, again, a weaker one compared with pro-Republican gerrymanders elsewhere. After the Garden State’s politically appointed redistricting commission deadlocked, responsibility for picking a map fell to the commission’s unaffiliated tiebreaking member. He selected a map proposed by Democrats under which 10 of 12 districts were carried by Joe Biden in 2020. But in 2022, Republicans were able to flip a district carried by Biden, giving Democrats a 9–3 advantage. That seat is again rated as a toss-up this year. By contrast, the median Freedom to Vote Act–compliant map has 4 Republican seats.
In all these states, other than Illinois, map drawers likely would have a reasonable argument in the rebuttal phase of litigation that the maps should not be considered partisan gerrymanders because of their competitiveness.
The False Positives
Maps in two states, Connecticut and Massachusetts, produced high rates of partisan bias under the Freedom to Vote Act’s rebuttable-presumption test, but our analysis suggests both would be able to rebut the presumption in litigation with ease.
In both New England states, Democrats currently win all their congressional seats by comfortable margins, even though Republican statewide candidates routinely receive between at least 30 and 40 percent of the vote (and more in some cases). This is a mismatch but seemingly an unavoidable one — none of the thousands of alternative plans we reviewed for each state would have resulted in low levels of partisan bias.
This outcome suggests that for these two states, the distribution of voters, not malfeasance by map drawers, causes the lack of Republican seats. Republican voters, though sizeable as a share of voters in both states, do not come close to being a district-sized majority in either state, making it impossible to draw lines that would yield a distribution of House seats proportional to the partisan balance of the state. They are simply too spread out.
Similarly, we regard Arizona and Missouri as false positives. Maps in both states triggered a presumption of gerrymandering under the Freedom to Vote Act, but on examination, there were multiple alternative maps in both states that had the same seat split between the parties and at the same time complied with the Freedom to Vote Act. This suggests a strong possibility that a reviewing court would conclude either that the maps did not excessively favor one party over the other or order at most minimal changes that would not affect the parties’ overall seat distribution.